Search the Site
The Fred Report - Weekly April 8, 2019
The FRED Report - Financial Research, Education & Data
Volume 11, Issue 25
Trading Week Starting April 8, 2019
Download PDF Version here
Summary of Market View
In Equities, we discuss two things. The first is what our targets for the markets mean and how advisors should react when these are hit. The second is Micro Cap stocks. Smaller stocks have been lagging for a while, and these most of all. Could they catch up? In Fixed Income, we discuss the Municipal Bond ETFs.
In Commodities, we discuss Industrial Metals, both futures based and mining stocks. This is an interesting area that looks like it bottomed. In International we discuss broad-based Chinese ETFs and in Chart of Interest we discuss Chinese Technology, and Real Estate.
Stock Review (Back to top)
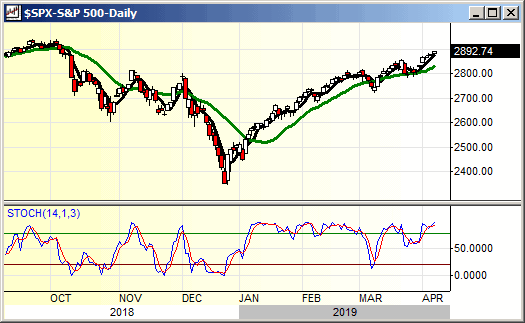
We had a very interesting conference call last week, and for those who missed it and are interested in ETF creation and indexing should listen to the call and read the article in the Monthly Review. Because of that conversation, we did not get to discuss another question we had in depth, and it is an interesting one: What does it mean when one of our targets for the year are hit? First, for new subscribers, we mention that we give a yearly forecast for most big markets in our January issue. The targets mentioned are designed to be hit! When they are, it generally means the market is at much higher risk for a move in the opposite direction.
Witness last year, where we had a target on SPY of 294 and the high was 293.94, which was followed by a larger than average pullback. However, this does not mean that a market HAS to change direction – it means that it is vulnerable to a change. We have two targets on stocks for this year – 294 to 302 (last year’s targets, again), and 220 to 200 on the downside, which now seems to be over exuberant on the downside. Further in our forecast we indicated the structure of the market should be “a rally in the first three to six months of the year to correct the oversold condition (in December 2018), followed by a pullback that should break the December low”. We would be cautious and look to risk management if the upside targets are hit by June. While breaking that low now seems over exuberant, we have to see how things look when there is a correction to this advance. Obviously, we will write more about this as time passes.
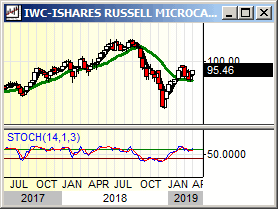
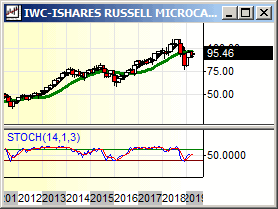
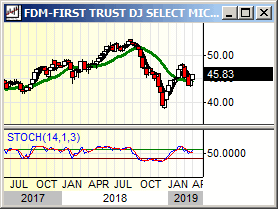
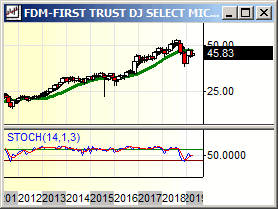
Smaller stocks have been weak on this rally, yet we have not looked at any of the Micro-Cap ETFs like IWC (iShares® Russell Micro cap Index) and FDM (First Trust® Dow Jones Select Micro Cap ETF). These are interesting vehicles that are not widely known or used. Part of the reason is that they are quite thin – IWC is the most liquid, and in addition is the strongest of the two charts. It is also made up of the smallest Micro Cap stocks (according to “Seeking Alpha”). IWC has intermediate support at 77, and short-term support from 91 to 90. Resistance is 99, then 105. The stochastics are interesting, a weekly sell, combined with a daily that is almost overbought (and weaker than IJR and SPY). This may be a good value and an interesting attempt – if this market continues beyond our target it needs to broaden out to be healthier and this is an overlooked area.
We should mention that the “solitary walk” of large stocks is not a new phenomenon and has been seen before. It is a sign of weakness but is more of a “condition” indicator than a timing tool. The longer this situation goes on, the worse the market reaction can be. The important thing for analysts and advisors to remember is that a common mistake is getting really negative too early. Watch the indicators!
Fixed Income Review (Back to top)
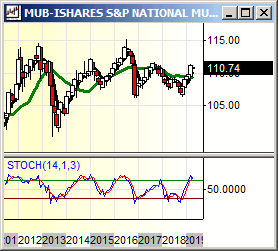
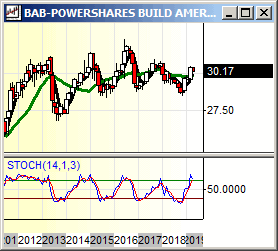
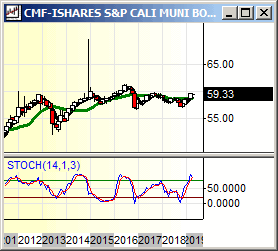
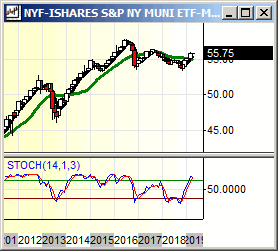
Given the recent action in TLT, we look at the Municipal Bond ETFs. We will look at our standard units: MUB (iShares® National AMT free Municipal Bond ETF), BAB (Invesco® Build America Bond Portfolio), CMF (iShares® California Muni Bond ETF), and NYF (iShares® New York Muni Bond ETF). These are representative and cover the biggest state markets as well.
First, let’s look at the national bonds. Of these two, MUB is now the strongest chart. It has support in layers from 109 to 107 and resistance is being challenged in the 111-area. The monthly stochastic is overbought and has not turned down, and the monthly stochastic is stronger but in the same configuration as TLT. Short-term stochastics are turning down, however, so this may not trade up much more. BAB is a bit weaker and has made a very definite lower high. It has resistance from 30.50 to 31. The daily stochastics on both are down and midrange. Let’s see what happens if they recycle. We do not think there will be another push but that is possible.
Second, we will look at the two specific state bond funds. These are trading about as equal to each other as can be, so there is no reason to favor one over the other. We realize analytics are less important than residency in the case of these units, but we will provide some basic info. First, the pattern is the same as TLT and the others – in fact these are a bit weaker than MUB, the strongest of these four ETFs. CMF has support from 58.75 to 58.25 or so, and resistance is the 59-area. NYF has support around 53.60 and resistance is from 56 to 57. The monthly stochastics on both of these are overbought, and the dailies have turned down and are midrange, similar to the national ETFs MUB and BAB. Again, if the dailies recycle it is possible that we see another push, but that is doubtful. Rather, we expect a range, and show charts, below.
Commodity Review (Back to top)
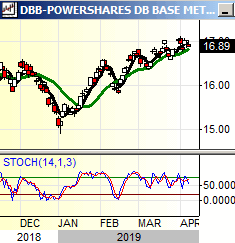
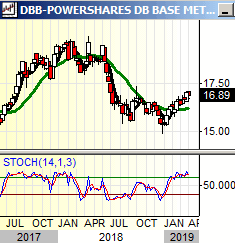
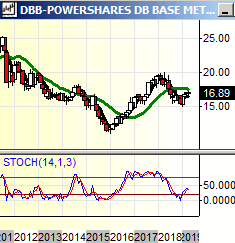
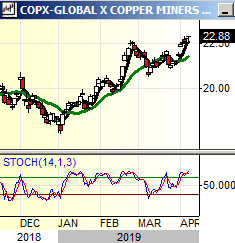
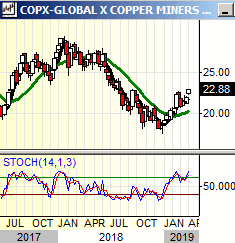
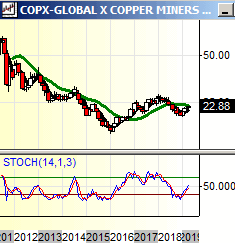
We have not looked at the industrial metals in a while, rather focusing our attention on gold and silver, and their respective stock ETFs. So, today we will look at DBB (Invesco® Base Metals Fund) and COPX (Global X Index Copper Miners). These two ETFs represent a good way to evaluate these, as DBB is futures based, and COPX is equity based.
DBB has had a pullback that is just a bit more than 50% of the move from 9 to 16.50. This would have put it at 12.75 and in fact this tested 12. Recall, though, that the 50% rule is more to give a buy point and not a tool for predicting the absolute low. The 12 area is support, and the monthly stochastic has moved into buy mode, suggesting the correction is about over and another intermediate advance in DBB may have begun. Resistance is 15 to 16.50, and above that would target 20. The weekly stochastic is overbought but not in sell mode, and the daily is up and not yet overbought. This has more upside.
COPX is similar, and it also had roughly a 50% pullback of the recent advance from roughly 8 to 28. That would have put COPX at 18, and the low has been 17.52. The monthly stochastic has turned up, and resistance is roughly 25 – 28. Support is 18 to 20, and the weekly stochastic is up but in slight sell mode, and the daily is up but not overbought. This could have another pullback, but the intermediate trend is likely turning up.
Both of these are economically sensitive, and the recent declines reflect the growth scare issues we have seen over the last few months. These two ETFs suggest some basing action is possible over the next few months, but by fall these should be performing well. Which would we buy? Either is fine, but we would lean a bit more towards DBB to have less correlation with the equity market. We show charts, below.
International Review (Back to top)
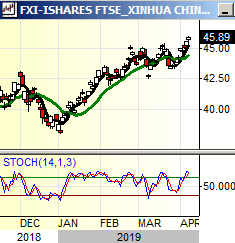
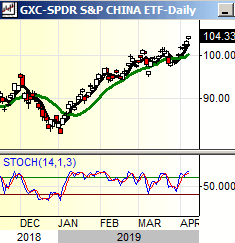
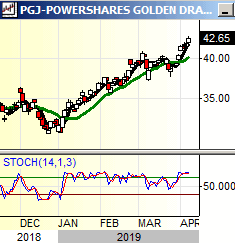
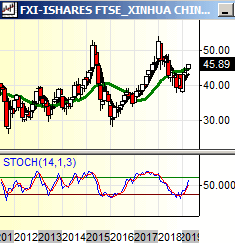
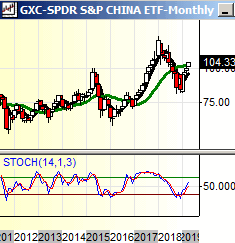
There has been more discussion of the potential for a China deal announcement in the next week or so. So, we will look at the China ETFs this week. We’ll focus on the short-term and the long-term, as there are some interesting things in these charts. We will look at FXI, GXC, and PGJ. We also look at two Chinese sector ETFs in Chart of Interest and will look at some peripheral country ETFs in the midweek.
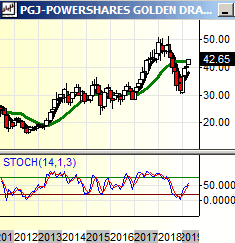
Periodically, we review these three units to see if anything has changed in the order of attractiveness – and it has not. The least attractive, FXI, remains the most popular. We say this because FXI still has not exceeded the double top of 2015, and 2018. It has layers of support from 42 to 38 and resistance is the 50-area. The daily stochastic is overbought, and the monthly is in buy mode, with more to go. GXC is our favorite blue-chip Chinese ETF, as it comfortably exceeded the 2015 high in 2018. It has support in layers from 91 to 84, and resistance is the 112 area. The stochastic pattern is the same as on FXI. Our favorite of these country ETFs is PGJ. It is the NASDAQ 100 of the Chinese ETFs, with a good bit of exposure to Technology in addition to the other, more blue-chip sectors. It has done considerably better than the 2015 high longer-term. PGJ has support around 36, and resistance is 45 to 51. We recommended this last year and most advisors that played it along with us have an average price of 38 or so. The daily stochastic is also overbought, more so than on FXI and GXC, and the monthly stochastic is up, suggesting some more upside. We have recommended a combination of GXC and PGJ depending on the client’s risk tolerance, and we see no need to change that recommendation.
Because of the overbought positions on the daily stochastics on these ETFs, we have some concerns that the China deal announcement will be a sell on the news event. These should resolve to the upside after this occurs. Traders may want to consider sale of partial positions with the idea of buying them back after a pullback. In particular, traders in FXI might consider sale here, and repurchasing PGJ or GXC.
Weekly Chart of Interest (Back to top)
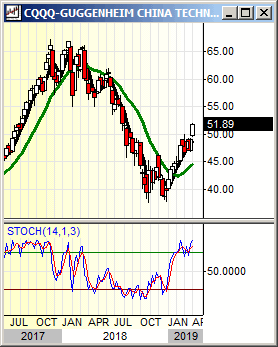
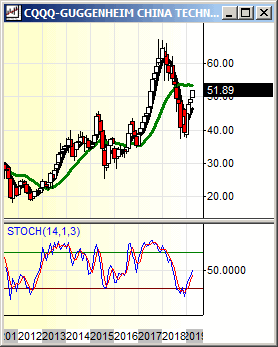
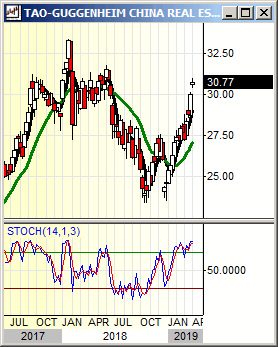
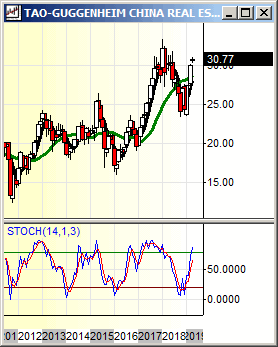
We will look at two Chinese sector ETFs: TAO (Invesco® China Real Estate ETF) and CQQQ (Invesco® China Technology ETF). These are more aggressive than the broader ETFs discussed in the international section and are also interesting as they shine a light on the performance of the Chinese economy. What is interesting here is that TAO is outperforming CQQQ intermediate-term. This suggests the Chinese economy continues strong, as tech is more affected by the trade difficulties than real estate. We show charts, below.

Member Log In

Who is Fred Meissner, CMT?
Listen here:
The FRED Report is not authorized, endorsed, or affiliated with the Federal Reserve of St Louis and its FRED Economic Data.


