Search the Site
The Fred Report - Weekly April 22, 2019
The FRED Report - Financial Research, Education & Data
Volume 11, Issue 29
Trading Week Starting April 22, 2019
Download PDF Version here
Summary of Market View
In Stocks, we discuss volume and volatility concerns, and then cover Healthcare stocks. This is continued in chart of Interest, with a look at Biotech. These sectors have declined more sharply than we expected. We mentioned this on the Thursday call, but wanted to amplify our comments. In Fixed Income, we look at the dollar denominated Emerging Market Bonds.
In International, we look at large cap Indian ETFs, and in Commodities we look at gold and silver. These metals look poised to rally.
Stock Review (Back to top)
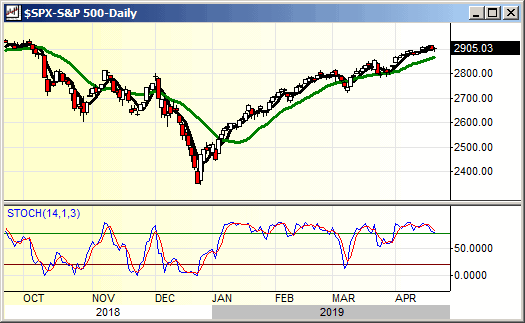
We have seen some articles about the drop-in volume and in volatility. We have had questions on these so we will address them here. Volume is not our favorite indicator for several reasons – the biggest is that it is very hard to identify buying vs. selling volume. We are not sure how much of a concern this really is. Regarding volatility – we have a volatility indicator and will publish this in the midweek (we have several things, such has Healthcare, that are more important to clients and should be published now). We do not use the VIX. Our indicator is in a position where volatility could increase, but it does not have to increase right away. We have more concerns about New Highs/New Lows, as they are weakening again, plus other breadth concerns. We still have no indicators that suggest anything other than maintaining positions, and a neutral outlook for now.
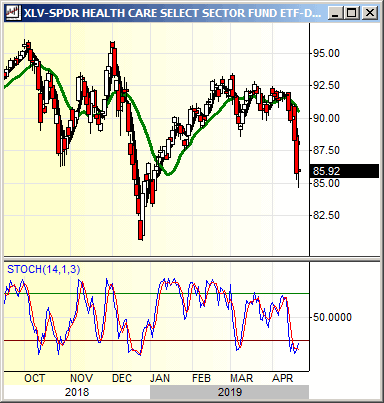
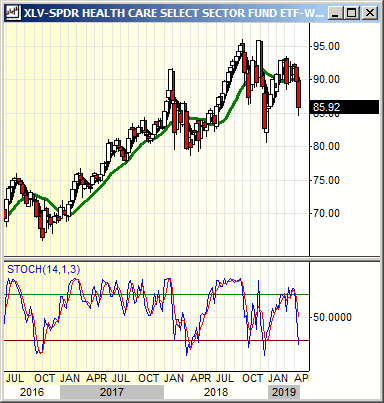
Healthcare collapsed after our downgrade to an equal weight and is now very oversold on a daily basis. The inverse “Prussian Helmet”, or spike on the daily chart also is a short-term positive. However, weekly and monthly indicators suggest some consolidation time is possible before new highs. Where could this go? Well, major support is 77 or so, not that far away, and there is short-term support here such that we would hold our healthcare names until the next short-term overbought reading, where we would consider sale. We look at Biotech in “Chart of Interest”.
Where could XLV rally? Let’s look at a few numbers. Resistance that should hold this at first is 89 to 91. This is the first objective of an oversold rally. Then, a test of the support at 80 should occur. If that breaks, a move to the gap at 76 or so – just through the 77-area, could occur. That would likely be it for corrective behavior. Watch Healthcare names that you own, and if they act less well than XLV sell them when 89 or so is tested. We show daily and weekly charts, below.
Fixed Income Review (Back to top)
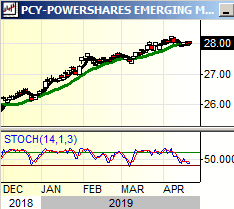
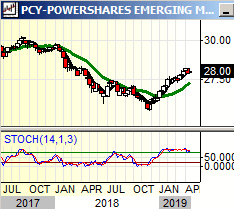
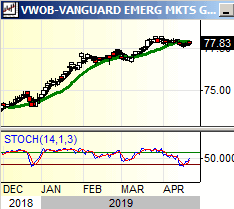
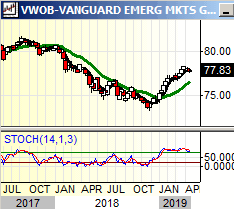
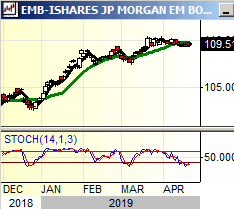
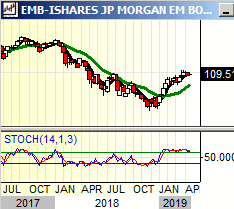
We will look at three dollar denominated Emerging Market Bond ETFs, and in the midweek, we will look at some of the local currency bonds. The ETFs we use for this are PCY (Invesco® Emerging Markets Sovereign Debt), EMB (iShares® JP Morgan USD Emerging Markets Bond ETF), and VWOB (Vanguard Emerging market Bond ETF Dollar denominated). In terms of liquidity, the biggest of these is EMB, then PCY, and in third place is VWOB. In terms of yield, it is: PCY 5.20%, EMB 4.98%, and VWOB 4.95%. Let’s look at the charts.
From a technical perspective, PCY and VWOB are very similar. We would give PCY a slight edge. The reason is the chart is stronger, and the yield higher. Support is in layers from 27.50 to 26.80, and resistance is similar, from 28.50 to 29.50. The daily stochastic is down but not yet in a buy recycle, while the weekly is “on the ceiling”, very overbought. The monthly is similar to TLT – up, but not yet overbought, such that this should have a few more months of stability. Technically this could rally more soon, even if the daily is not recycled, as the daily stochastics on EMB and VWOB have completely recycled, as you will see below. In this case, we are using the stochastic as a measure of relative performance.
VWOB has support around 76 to a little below, and resistance is in layers from 79 to 80. The daily stochastic is a buy recycle, and the weekly is also on the ceiling but less strong than PCY. The monthly is overbought but has not turned down, similar to PCY and TLT. This would be our second choice, although as mentioned the yield is less than PCY, and EMB. Speaking of EMB, it has support from 108 to 106, and resistance is 111 to 112.50. The daily stochastic is oversold, and not yet a buy recycle. The weekly is overbought and looks closer to turning down than the other two. The monthly is up but less strong than the other two – it also suggests more to go on the upside, or at least stability for the next few months. We show daily and weekly charts of all of these, below, and suggest looking at the monthly charts as well.
Commodity Review (Back to top)
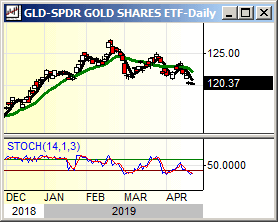
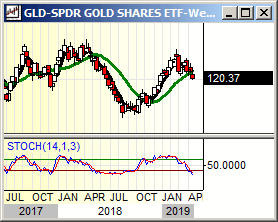
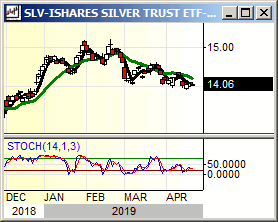
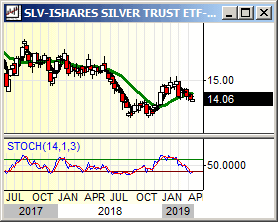
GLD (SPDR Gold Trust) and SLV (iShares® Silver Trust) are in interesting positions at this juncture. They have been pulling back over the last few weeks, and the weekly stochastics are down and in oversold territory. Accumulation models, while not stentorian, are making higher lows and support a rally from this area. So far, GLD and SLV have stayed within long-term bases and could enjoy rallies if they can turn up from here. Let’s look at these!
GLD has support between 120 and 118 – here in other words. Observe that the weekly stochastic has come down into oversold territory for the first time since May/June of 2018, and this oversold is making a higher low. This suggests an intermediate uptrend is forming. The daily stochastic has one failed buy signal, a concern but often the second one of these works, the decline from the first has been relatively benign – a gap followed by some stability in this support area. Note the monthly is up but not overbought and has also made a higher low than the last buy recycle which as mentioned in a sign an intermediate uptrend is forming. From a price perspective, to confirm an uptrend we need to see trades above 131.15.
SLV is a similar, but weaker chart with short-term support in this 14-area. SLV is fully testing the bottom end of a support range, while GLD is testing the top end of a similar range. The daily stochastic is in buy mode, in contrast to GLD, and price has started to rebound a bit. The weekly stochastic is similar, down into oversold for the first time since summer/fall of 2018 and it has not turned up. We observe that the monthly chart is more of a double bottom, although the recent low was slightly higher. There is less reason to think that this is forming an intermediate uptrend, but more reason to assume this is going to rally right away. Watch this and if it starts to move up GLD should follow. In general, gold should be stronger than silver in a healthy metals market, and it is here.
One last point is that if you want gold exposure and have smaller accounts there is a cheaper ETF, IAU (iShares® Comex Gold trust), which trades mostly in line with GLD. This is a good solution if you want a more flexible amount of this commodity in accounts.
International Review (Back to top)
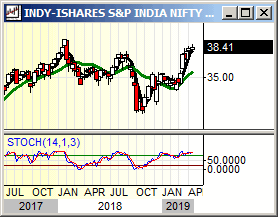
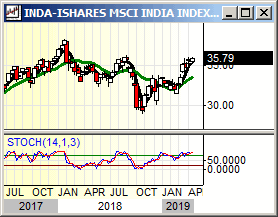
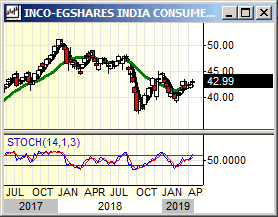
Once again, we have delayed swapping India for a broad based Emerging Market ETF, and so far, this is serving us well. We will look at some of the Indian ETFs we cover, with the idea of determining whether this is still the best place to be, and whether we should continue with current positions. We follow INDY (iShares® Nifty Fifty India Fund), INDA (iShares® MSCI India Index Fund), INCO (EG Shares Consumer India), and EPI (Wisdom Tree India Earnings Fund) in the large cap Indian ETFs. We will restrict ourselves to those as the small cap Indian ETFs are trading much worse. If they improve, we will do a separate piece on them.
We are using INDY, a cap weighted ETF of the 50 largest companies on the Indian Stock Exchange, in our models. It is still the strongest of these ETFs. It has short-term support at 36 and intermediate support from 33 to 31. Resistance is 39 to multi-year highs. The daily and weekly stochastics are overbought, and the monthly suggests there is more to go on the upside. INDA is the second strongest of these and is weaker than INDY but not by much. It tracks a broader index – 85% of all the stocks on the Indian Exchange. It has resistance from 36 to 38 before it makes a new high. Support is in layers from 34 to 30. The daily stochastic is close to overbought and is technically in sell mode, while the weekly has become overbought – the monthly, like INDY, suggests there is further to go.
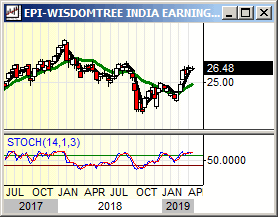
The last two of these are performing worse. INCO tracks a market-weighted index of consumer stocks. It has support 42 to 39, and resistance is 45 to 48. The weekly stochastic is up, but not overbought, and the daily is overbought and almost in sell mode. It is an up and advancing chart but is lagging. EPI is an interesting Smart-Beta idea. It is a total market index of stocks weighted by strong earnings. One of the reasons it is performing less well is that there are small cap Indian names in the index, and as mentioned these are performing much worse (compare SCIN’s intermediate chart with that of INDY). EPI has support at 13.50 or so, and resistance is 16.50 or so. The best thing you can say about EPI is that it is lagging, but a Head and Shoulders bottom on the weekly chart. The daily stochastic is in sell mode and the weekly is overbought but not yet in sell mode. This might be a way to play for some small cap Indian exposure (if you MUST have this) as the stocks are fundamentally strong. It is the worst of these charts.
Weekly Chart of Interest (Back to top)
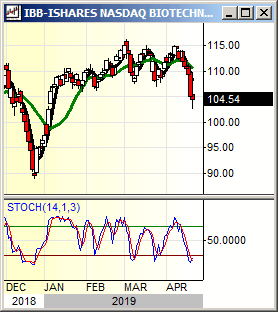
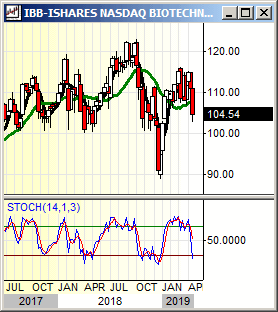
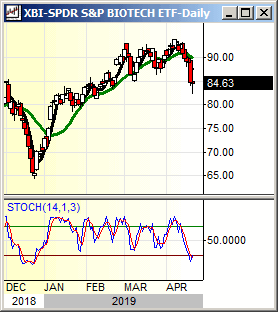
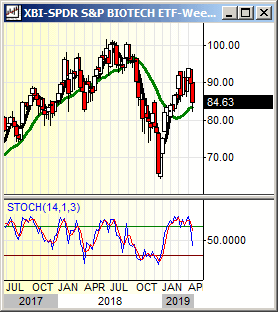
A key part of the Healthcare sector is Biotech so we will quickly look at two ETFs, IBB and XBI, here. IBB is still weaker than XBI, mostly because XBI has rallied more than IBB over the last few months. Both have made lower highs and turned down. Readers can see that the weekly stochastic on IBB is further down the range than XBI, but that both are in sell mode. IBB has support around 102, and resistance around 117. XBI has support from 84 to 80, and resistance is around 92 to 94. Daily indicators are oversold and as long as the spike lows hold on the daily chart a rally is possible in both of these ETFs. We gave preliminary sell points on XLV and will do so for IBB (108 to 112), and XBI (88 to 92). We show daily and weekly charts, below.
Member Log In

Who is Fred Meissner, CMT?
Listen here:
The FRED Report is not authorized, endorsed, or affiliated with the Federal Reserve of St Louis and its FRED Economic Data.


