Search the Site
The Fred Report - Mid Week Update December 21, 2011
The FRED Report – Financial Research, Education & Data
Mid Week Update
Volume 3, Issue 102
December 21, 2011
Download PDF Version here
Update of Market View
In the Weekly, we mentioned that we wanted to see some better action, and the market has responded in kind! We are still working on our yearend piece, but so far the technical indicators looks a bit better to us than we would expect, given the lousy fundamental backdrop. The reason for this can be that the markets often discount fundamentals. However, another reason could certainly be that the market does not UNDERSTAND the fundamentals. Fortunately, the daily chart of SPY (and other indexes) has a potentially interesting pattern with reasonably clear bullish or bearish benchmarks. I like this pattern because it is not being widely discussed, and therefore has a better chance to be valid. The pattern is an Inverse Head and Shoulders (Head and Shoulders Bottom). The left shoulder is the August 9 – September 21 period. The head is September 22 – October 7, and the rest of the pattern comprises a higher right shoulder.
It is also possible that another Inverse Head and Shoulders has formed on the charts. That one has a left shoulder From November 1 to November 16, the head is November 17 to November 30, and the right shoulder is the remainder of the chart. Both patterns are somewhat clearer on the daily chart of the NYA. Both patterns appear on most of the other indexes as well. While uncommon, especially an inverse, a Head and Shoulders within a Head and Shoulders has occurred before, and has bullish implications. Perhaps more important are the benchmark prices we mentioned, as these define risk, and suggest potential reward.
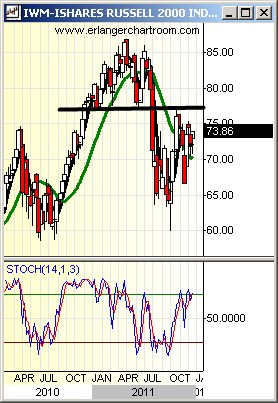
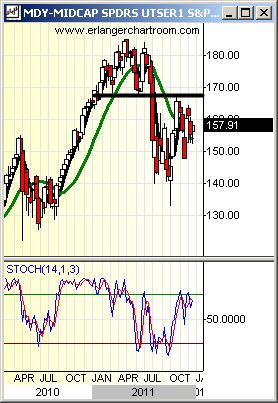
Should the markets exceed the low of November 25, both inverse patterns will likely be broken, and stocks could test and likely exceed the October of 2011 low. On SPY, this is 116.20 and is approximately 6% from the December 20th close. Readers can certainly look at the other indexes. In terms of reward – the neckline on both patterns is the same – 127.50 to 130 on SPY, 7900 roughly on NYA, 75 to 77.50 on IWM, and 165 to 168 on the MDY – in other words, the recent resistance on the daily charts. Should these areas be exceeded the reward could be 12% or more.
Right now, indicators suggest that the resolution of these patterns will be to the upside – but the beauty of the patterns is that the market will tell us which it is going to do. We remain with our forecast of a close at the 1220 area, slightly down from December 20th’s close. The market looks choppy into the end of the year. But, should these levels be breeched in either direction, a move of significance would be underway.
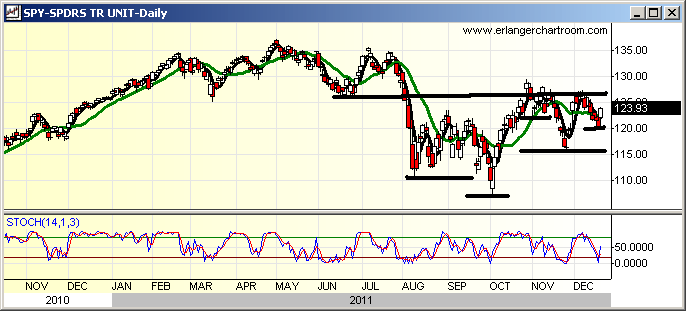
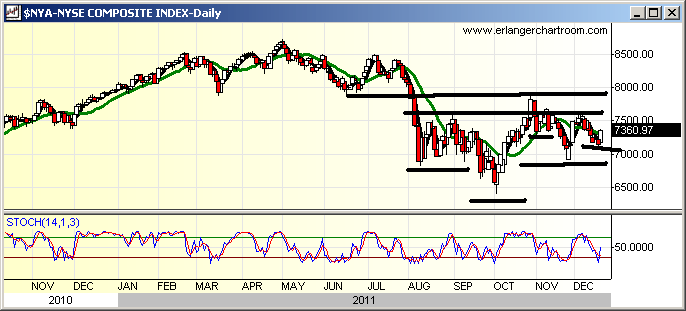
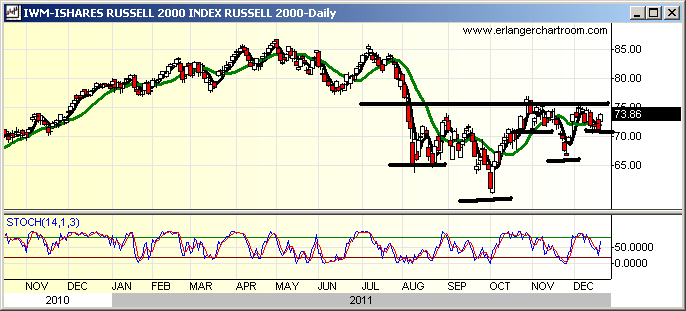
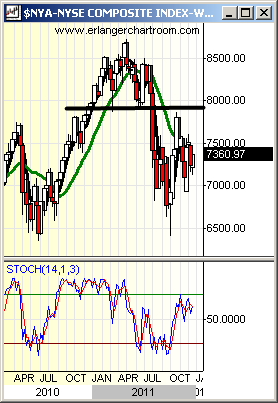
We show, once again, the weekly charts of the indexes we are monitoring to show where the resistance is on the stock market. Should these areas be exceeded (NYA 7700 – 8000, IWM 77 – 78, MDY 168 or so), it would be another strong indication that the market is going to have a strong first half of 2012. Please compare these charts to the previous section.
Member Log In

Who is Fred Meissner, CMT?
Listen here:
The FRED Report is not authorized, endorsed, or affiliated with the Federal Reserve of St Louis and its FRED Economic Data.


