Search the Site
The Fred Report - Weekly October 18, 2010
The FRED Report - Financial Research, Education & Data
Volume 2, Issue 83
Trading Week Starting October 18, 2010
Download PDF Version here
Summary of Market View
The Stock market continues to trade well, but is overbought enough for a sharp correction to occur at any time. The mid-term election could provide a catalyst.
Bonds have started to fall, and we continue to look for higher rates this fall.
The dollar still looks like a countertrend rally, and gold could have a countertrend decline in sympathy.
Stock Review
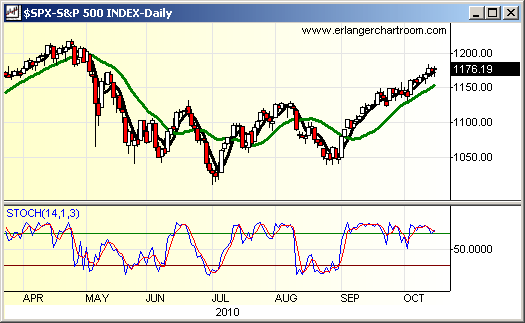
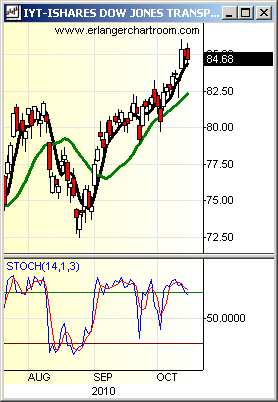
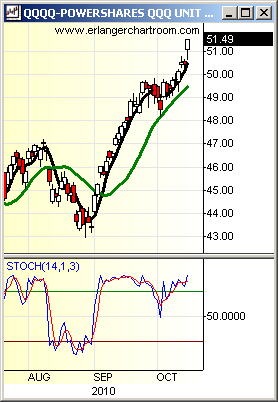
The stock market rallied again last week, challenging the 120 area on the SPY (SPDR S&P 500 Trust), the April highs. Perhaps more important, the IYT (iShares Dow Jones Transportation Index) has moved very close to the April highs and had a stronger week than the SPY. One of our favorite sectors has been Technology and we note that this sector, as well as the NASDAQ 100 and the QQQQ (Powershares QQQ) had an extremely strong week, with the QQQQ making new highs for the move. At the same time Financials and banks were quite weak.
While we remain quite bullish intermediate–term, we are seeing some overbought readings that suggest a pullback in stocks may be needed to set up another leg up. It is possible that the election might cause this, assuming gridlock is now being discounted, as we have discussed on our weekly Thursday conference calls. We note that in 1994, the last time the Republicans regained the House of Representatives, the S&P 500 stood at 473.77 on October 28. By December 9 the index had fallen to 446.97, a drop of just over 5%. Perhaps more important to our readers – the S&P 500 was 617.48 on December 8, 1995, a gain of just over 38%.
Subscribers should use the next two weeks to comb through portfolios, look for underperforming stocks, and consider selling these to raise cash. Some financials are hitting new 52-week lows, for example. We would then hold that cash and hope to redeploy cash on a sharp drop after the election. Understand we are not recommending wholesale liquidation, but rather judicious pruning and waiting to deploy new money until after the election. Other than this we feel subscribers should be invested. The overall market looks strong enough that a significant drop after the election is by no means assured.
Fixed Income Review
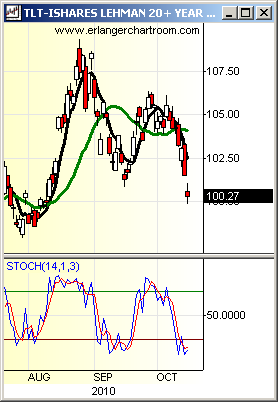
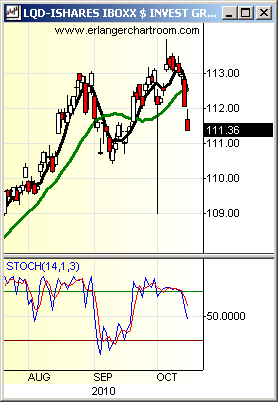
The bond market has finally started to go down here. More important, my accumulation model has broken down through the first level of support and is within striking distance of the last bit of support. If this last area breaks, bonds should test the 94 area we have been forecasting. The FPO (Fred’s Price Oscillator) on the TLT (Barclays 20 Year Treasury Bond iShare) has moved down to -12, not an extreme reading, so there is more left on the downside, a short-term bounce notwithstanding. Should there be such a bounce, key resistance numbers are 103.20, and 104.40 on the TLT.
We continue to prefer the LQD (Investment Grade Corporate Bond iShare) and the BWX (SPDR Lehman International Bond Index ETF) on this decline in bonds, and should this decline continue. The patterns are better and there has been less of a run up in these areas. However, it is important to note that we remain longer-term bond bears and commodity bulls.
Commodity Review
The GLD (SPDR Gold Trust) has moved above our trading objective of 130 and we have sold down to a normal weighting in the metal. We still look to be at risk of a decline short-term, and a move below 132 would target 128 or so. We would use a drop as a buying opportunity and we still think a dip is possible into the late fall. We are not actively pursuing that scenario, as gold remains a favorite long-term investment for us and often a trading objective vs. a long-term objective can be sort of a “forest for the trees” scenario. We remain longer-term commodity bulls, as mentioned above.
The DBC (Powershares DB Commodity Tracking ETF) is currently right around our objective of 25.00 and is starting to show some signs of fatigue. In addition, oil has failed so far at the 37.00 area on the USO ((United States Oil Fund) and could have a seasonal decline into late fall (we caution that seasonals have NOT worked well this year, however). Natural Gas, once again, is close to making new lows, also a concern.
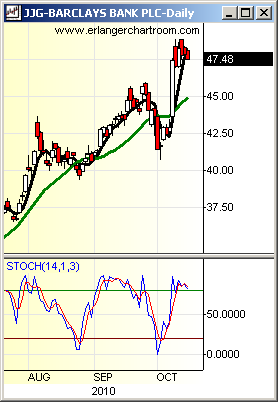
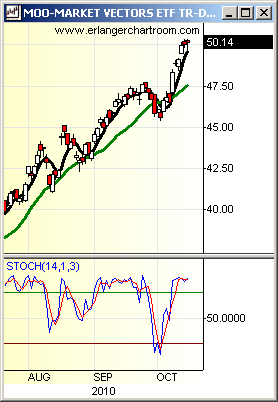
Last but not least, Agricultural commodities such as wheat should likely be sold or hedged here (we had some questions in this area). The JJG (iPath Dow Jones – UBS Grains Total Return Sub Index ETN) is in the vicinity of intermediate resistance, and even if it goes through probably has at most another two weeks before it becomes overbought. Overall, caution, and possible switching to MOO (Market Vectors Agribusiness ETF) from JJG is likely warranted.
International Review
In last week’s Weekly and Midweek Reports, we noted that the dollar looked ready to rally. While we had a down close for the week, the set up is still present, and Friday was an outside day up in the dollar. We note that a move up to 77.95 (realistically 78) would change the trend of the DXY to neutral from down. That would be a signal that the dollar is starting a rally that could take it to 81.00. This is not a great short sale signal on the Euro, though we note that the currencies trend more strongly than any market we follow and even my special FPOs (Fred’s Price Oscillators) on the currencies can go to extremes because of this. But be alert, a rally in the dollar could bring about sharp drops in gold and such that we are looking for.
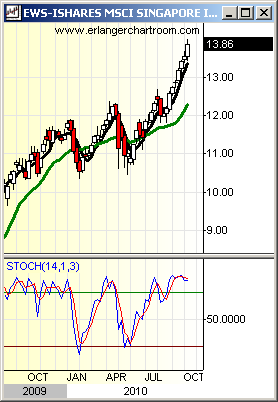
On last Thursday’s weekly conference call, we had questions on the EWM (iShares MSCI Malaysia Index Fund) and EWS (iShares MSCI Singapore Index Fund). These markets remain strong but also look like corrective behavior could be exhibited. Should the dollar rally, the FXY should pull back and this could spark a rally in the JOF. We continue to look for the 9.50 area.
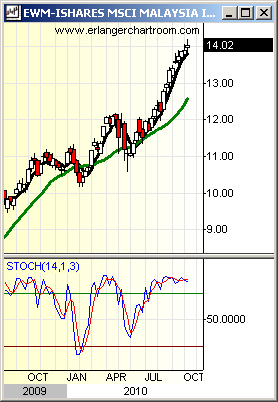
Weekly Chart of Interest
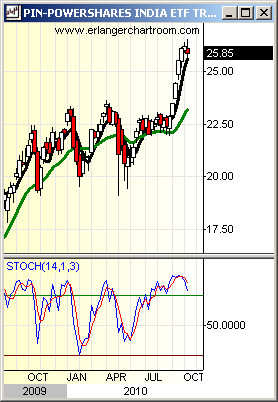
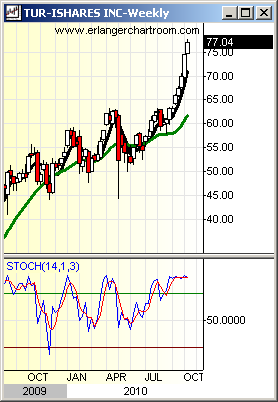
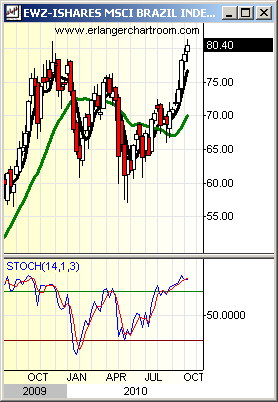
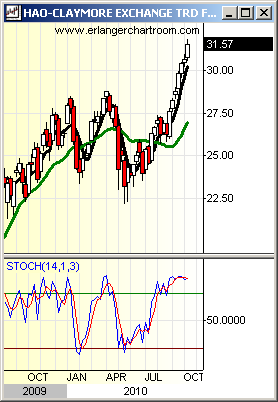
We show selected weekly charts of foreign market ETFs that are top performers but risky. These are PIN (PowerShares India), TUR (iShares MSCI Turkey), EWZ (iShares MSCI Brazil), and HAO (Claymore China Small Cap). While these are a bit riskier as investments, at least at these levels, they have been strong performers and may be attractive for traders.
Member Log In

Who is Fred Meissner, CMT?
Listen here:
The FRED Report is not authorized, endorsed, or affiliated with the Federal Reserve of St Louis and its FRED Economic Data.


