Search the Site
The Fred Report - Weekly July 11, 2011
The FRED Report - Financial Research, Education & Data
Volume 3, Issue 55
Trading Week Starting July 11, 2011
Download PDF Version here
Summary of Market View
The stock market looks to have a choppy week due to expiration and some overbought conditions. That said, we look for this rally to resume no later than next week, and carry the SPY to new rally highs.
Bonds have rebounded, but look weak technically and we should see a decline into the end of the summer months, and perhaps into the fall, after this rebound in bonds runs its course.
Commodities look poised to rally, and indeed have been rallying, with the exception of oil – but we expect oil to join the party soon.
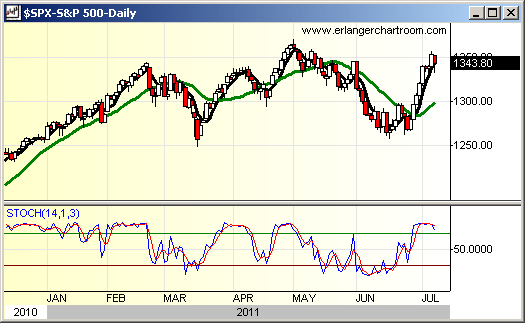
Friday’s sharp drop was as expected and does not alter the TECHNICALLY bullish case. Indeed, indicators suggest a bit more retracement is possible, and some choppiness, as well – it is expiration this week. We would love to see the SPY in the 132 area but caution that we feel surprises may occur on the upside.
A number of subscribers have written regarding the bad jobs number – and yes, it WAS a bad number. But, don’t forget that the market climbs a wall of worry, and that things are most precarious when there is not a cloud in the sky. Form a fundamental/strategic standpoint, any debt ceiling deal that includes Social Security is likely to be bullish for the markets, as these entitlements are probably the most important budgetary items facing this country. Doing something about “the third rail” will be a big long term plus, as touching it once should mean more touches in the months and years ahead.
This expiration should be choppy but should ultimately resolve itself in upside behavior, either this week or next week. We would use declines to the 133 to 132 area to add to positions for a summer rally that should ultimately carry to the 140 – 144 area on SPY. Because of some weekly cycles, should this week be a down week on the SPX, we would be especially bullish for the rest of the month of July.
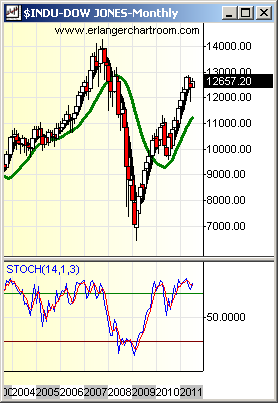
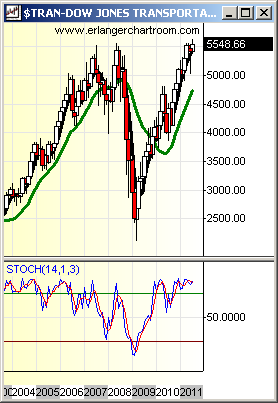
We show monthly charts of the Dow Industrials and Dow Transports, below. Note that the Transports have already made an all time high close. The Transports are our favorite indicator of economic strength so this is a big plus.
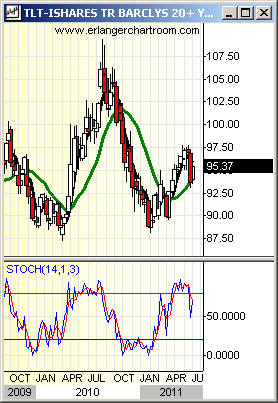
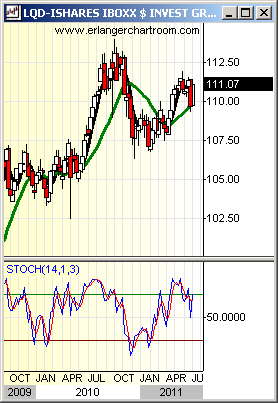
The TLT has bounced back up to the 95-area resistance, as we thought it might, after testing 93 – 92 area support. While daily stochastics have given a small buy signal, weeklies have just started coming down, and accumulation models and FPOs (Fred’s Price Oscillator) suggest that this rally will ultimately fail and end in lower lows. LQD has held the key 109 area and rallied back. This is noteworthy because, unlike the TLT, this ETF is in a long-term uptrend. As such, it remains more attractive for bond investors on a technical basis.
We want to be sure to mention the BWX, which is trading in line with the Euro and the FXE. Should FXE break below 140 this ETF could be vulnerable, and a move below the 60 area could target 57 or lower.
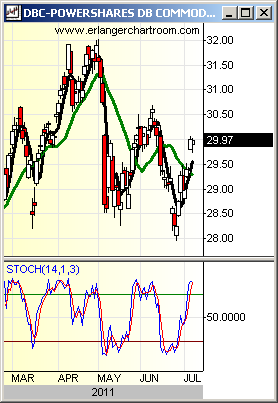
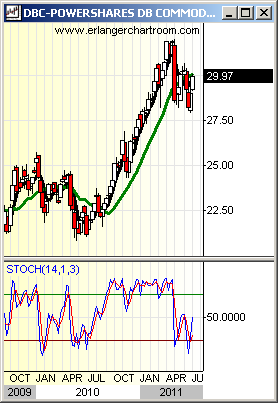
We show daily and weekly charts of the DBC below, and note that both charts have etched out bottoming configurations. From a momentum standpoint, the new lows in the June 23 – 27 timeframe satisfied the divergence bottom signal given by the FPOs after the initial drop in early May (again, see the Midweek Report of June 29, 2011). A move above the 30.60 area would complete technical bottoming patterns in these – and advisors should add commodities to their asset mix at that time if they have not done so already.
We wrote about JJG and MOO recently and they have started to rally. Another strong idea in the agricultural space is PAGG.
GLD has started to rally and should outperform SLV on this advance. The only commodity that is not performing in line with a rally is oil, and that should change over the next few weeks.
International Review
We take a look at Japan this week. While we think the news of another earthquake and a Tsunami warning will likely not have too much effect on their markets, we have not analyzed them much in the last month.
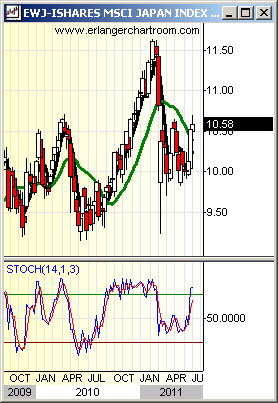
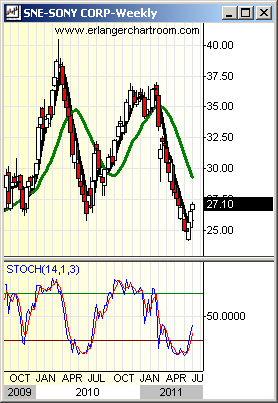
After the quake, we recommended four basic units and we will look at these, below. First, it is worth noting that we had the same sort of momentum configuration shown on some of the commodities, where lower closing lows were forecast (see our Midweek review of 6/29/11). This has occurred on most of the Japanese ETFs and ADRs we recommended – EWJ, the big cap, export oriented ETF. All of these Japan ETFs and ADRs have pretty much rallied, with the exception of SNE, which continues to trade weak, and from a technical standpoint should be sold.
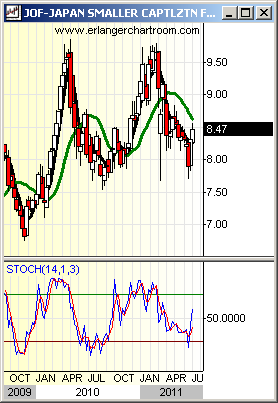
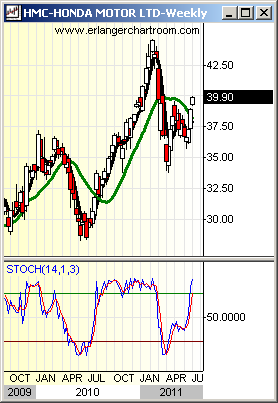
We provide some observations on the other units. First, EWJ is one of the strongest – not surprising as this big cap ETF contains most of the Japanese export oriented companies. Note that it is right at the 10.80 resistance area, similar to HMC, which is being held by 39 – 40. Both of these are holds, and should they advance through these respective resistance areas they would be buys once again. JOF, the small cap Japanese ETF is a bit below the resistance, and is less attractive until it moves above 8.85.
We note that Japan has not been our favored vehicle for investing in the Pacific countries for a while. New subscribers can email and we will discuss this with you.
Weekly Chart of Interest
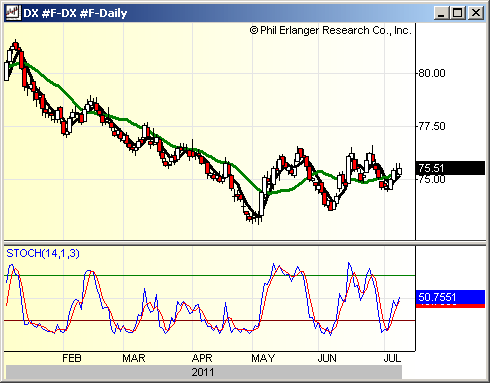
The dollar is still holding support and looks to rally. Indeed the pattern is favorable enough to suggest that this is the week the Buck moves above 76.60 – and should this occur while the FXE moves below 140 a large move should result.
Member Log In

Who is Fred Meissner, CMT?
Listen here:
The FRED Report is not authorized, endorsed, or affiliated with the Federal Reserve of St Louis and its FRED Economic Data.


