Search the Site
The Fred Report - Weekly June 27, 201
The FRED Report - Financial Research, Education & Data
Volume 3, Issue 51
Trading Week Starting June 27, 2011
Download PDF Version here
Summary of Market View
The stock market is moving down into the areas of time and price we picked for a significant low, back in April. In fact, in many ways the market is stronger than expected – we thought we would be here in May rather than June. We hope this week is up or down slightly – this would likely set up a rally.
The TLT is showing some selling indications – we have been long for a while and suggest taking steps to protect profits. It looks less likely, although still possible, that we fully test our target ranges.
Gold and oil look like they should rally as well.
The dollar remains a favorite SPECULATION on the long side.
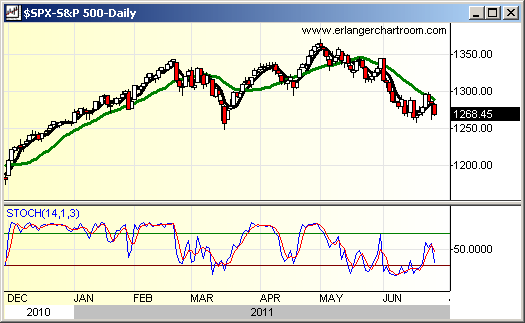
The stock market is fulfilling our forecast of a violent up and down period with a downside bias, and this past week was down a relatively small amount. But, there was large volatility. This has served to flatten out the 5 day moving average, and as we discussed last week – this should move it into position to cross fairly early in an up-move – which would constitute a good buy signal should this occur.
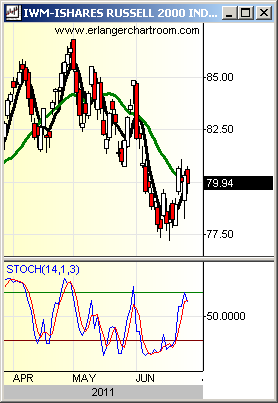
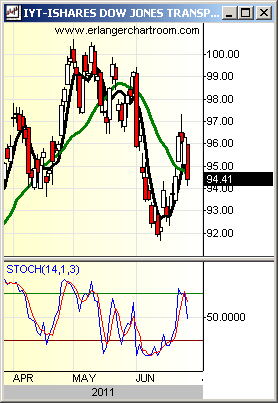
There are some other favorable things going on under the surface as well. The IWM and IYT are trading stronger than the SPY, and accumulation models on all stock indexes have improved markedly last week. Weekly breadth was positive on the NYSE and NASDAQ. New highs exceeded new lows (and our model has comedown from an overbought position as well). Bearish sentiment continues to improve – last week was 28% bears, up a good bit from the lows. Another week or so of this and we could generate a strong intermediate buy signal.
While there are some concerns, these are receding as of this writing. Obviously, trend following indicators are negative on a daily and weekly basis. Our accumulation models on XLI and XLB continue to be quite negative as well. This could mean that the economy is going to be weaker than we expect, and weaker than the consensus. This would obviously defer a good buy signal (which, as of this writing, we do not expect).
We expect more volatility this week, again with a slight downside bias, on increasingly bearish sentiment. We will look at our monthly indicators at the end of the week and see how it then looks.
The bond market rallied last week, but was weaker than expected, and accumulation models have started to look toppy. We would be VERY careful in this environment as bonds could start to do very badly. We are running out of time to test the 100 area on TLT before the next decline starts. Traders should be defensive here.
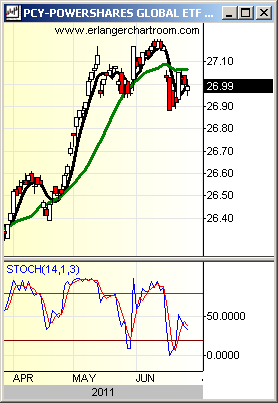
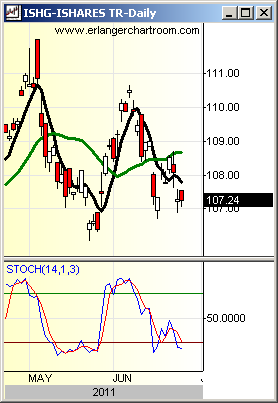
We will examine a couple of other ETFs that could provide some diversification if rates start to advance in the second half of the year. The first is PCY (Powershares Emerging Markets Sovereign Debt), which gives some exposure to Brazil and Russian debt – while this seems risky, the yield now is roughly 5.59%, which is greater than the TLT. Another idea for some developing markets debt outside the US is ISHG – this has debt of developing countries, ex-USA, including Canada and Norway – both interesting and stable markets with a commodities orientation. Yield as of this writing for ISHG is 1.95% and this is a shorter term vehicle than TLT, should rates rise
So far, the topping action in the TLT accumulation model is mirroring the SPY accumulation model, which suggests our scenario of a summer rally in stocks is intact, along with a corresponding decline in bonds. Protect profits in these bonds.
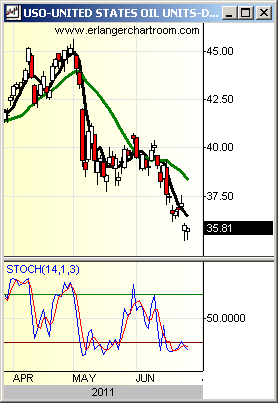
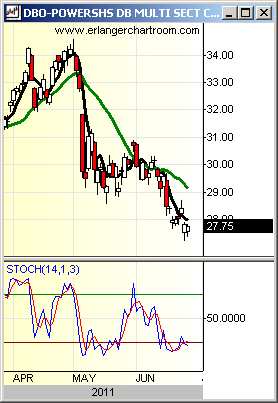
Oil has been in the news of late, so we will take another look at it here. First we will look at the USO. While this is the most popular ETF, it may not be the best one to invest in as it is heavily weighted toward the front month. A better alternative, and one that we look at in our analysis, is DBO. We show charts of both, and note that both of these closed in the higher end of the range on Thursday and Friday. This suggests that, as we are expecting, oil prices are actually getting ready to rally – government intervention notwithstandingT. Aggressive advisors looking to add a bit more money this week should carefully consider oil stocks, or the XLE and/or OIH.
A quick note on gold: Our accumulation models did not confirm last week’s sharp drop at the end of the week, and we will write about this in the midweek. I may look to add to gold positions later in the week.
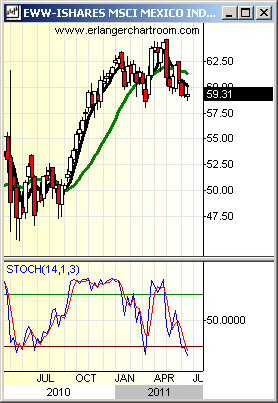
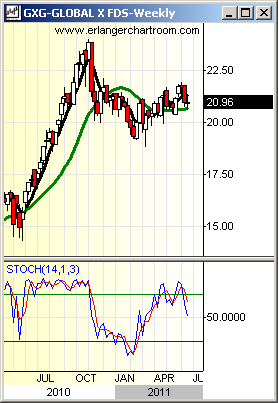
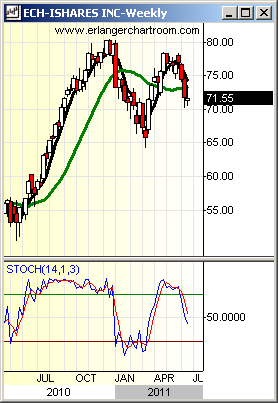
First up is EWW (iShares MCHI Mexico Index Fund), which looks strong within the context of a consolidation, Second is GXG (Global X Interbolsa FTSE Columbia 20 ETF), which is relatively flat compared to ECH (iShares MSCI Chile Index Fund), but still an up pattern, and third we will discuss Chile ECH, an interesting market with a decent technical pattern. When we compare these areas with stronger European markets (EWG) you can see these markets are holding their own. Overall, this is an area of diversification for international money that should gain in popularity as 2011 progresses, and the European crisis matures. Advisors may want to add some money to this area now, as we continue to believe Greece will be a problem later on, and perhaps sooner rather than later.
The UUP (PowerShares DB US Dollar Index Bullish) remains our favorite speculation, and we reiterate that should FXE decline through 140 the dollar should get a nice pop. One of our “Fred’s Fab Four” forecasts for 2011 (December 2010 Monthly Research Piece) is that the dollar and commodities will rise together in the second half of 2011. Should this forecast be correct, this should start relatively soon – and should be watched for. If this starts to occur, go with it as it could be a very big move.
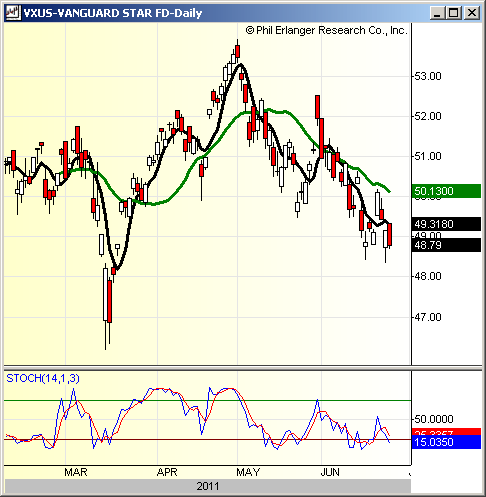
We look at the Vanguard Total International Stock Index ETF, VXUS. This is a new ETF, so only a daily chart is available, but it is exactly what the symbol sounds like: an index fund incorporating all markets around the world, NOT including the US markets. It looks to be an interesting way to get international exposure.
Member Log In

Who is Fred Meissner, CMT?
Listen here:
The FRED Report is not authorized, endorsed, or affiliated with the Federal Reserve of St Louis and its FRED Economic Data.


