Search the Site
The Fred Report - Weekly February 13, 2012
The FRED Report - Financial Research, Education & Data
Volume 4, Issue 13
Trading Week Starting February 13, 2012
Download PDF Version here
Summary of Market View
The stock market may have hit a short-term stopping point, but momentum indicators suggest higher highs are in store, whether immediately or after some choppiness.
Treasuries tried to break down but were unable to do so – now a small rally should ensue, which we would use to lighten these positions.
While we prefer US Small Cap stocks to Emerging Markets, improvement in the European crisis may be setting up a trade to the upside here, that should last for a month or two before the primary relative trend reasserts itself.
Agricultural commodities and portfolios look to be moving into the buy zone – and we discuss sentiment indicators as there have been some questions about recent readings.
Stock Review
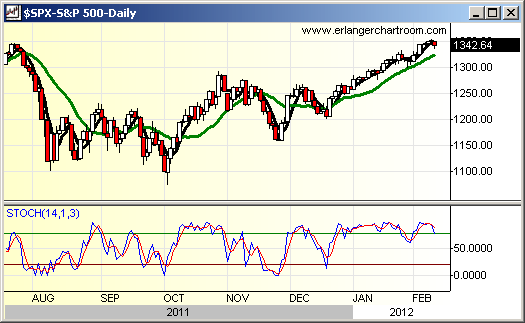
Last week’s market featured (finally!) the “worst day of 2012”, on Friday. Several have asked if this is the “top”, or whether this is the start of the long anticipated correction. It is certainly possible that we see some more corrective action as the market IS short-term overbought. But, we still anticipate higher highs either immediately or after a very quick, sharp pullback. We give discussion and observations, below.
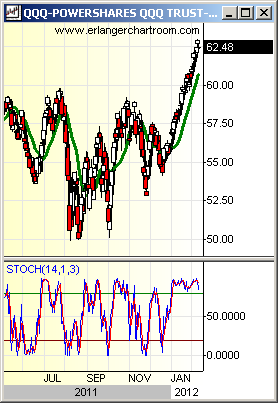
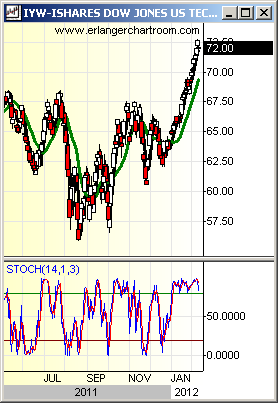
Sentiment indicators (see “Chart of Interest” section) remain positive as do most condition and indicators. Most Internet market pundits are suggesting to buy on a correction – this means either no correction or one that looks bad enough that nobody will avail themselves of it when it occurs. So – should we see some problems with Europe in the next few days we would use them to add to positions. Indicators suggest that should European indexes pull back sharply they should be bought. A bigger concern would be some sort of flare-up in the Middle East. We have had concerns for several months about this – this would be a bigger surprise and might be “the bus we don’t see”. Should a Middle East flare-up occur we would watch carefully but still likely buy a solid dip. Regarding short-term overbought conditions – the most overbought sector right now is technology and we show charts below. There is some possibility of a sharp drop in this sector, and should we get a disturbing report that hits these stocks we would use that to add to positions overall. As traders we are a little cautious – as investors we are not concerned.
Whether or not we see some choppiness, we expect that the market rally continues and this time the sentiment indicators fall off, and the news improves – which could set us up for the first real correction since October – but this is likely a few weeks or more away.
Fixed Income Review
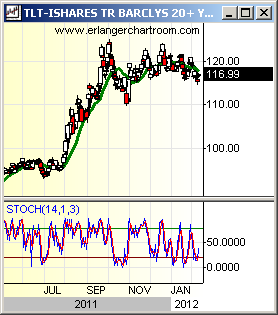
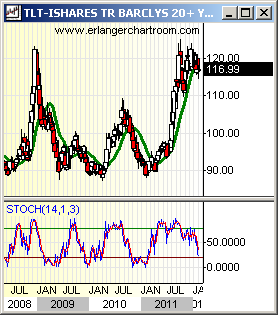
TLT (Barclays 20 Year Treasury Bond iShare) has repeatedly tested the 116 area, but never had two successive closes below it. The TLT has bounced off that level again and looks to challenge the 120.80 area, which would be a good sell point. We remain concerned about TLT, although our accumulation model continues to hold on as well. Still, TLT should underperform and we would use strength to raise some cash and put it into other income areas.
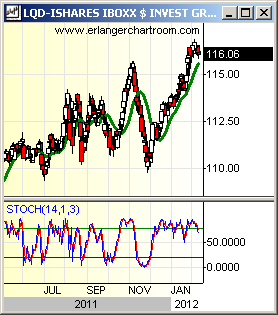
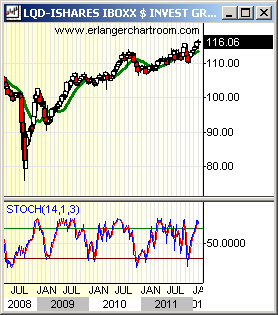
In the last several letters we have discussed preferred stock ETFs, but one of our favorite areas is LQD (Investment Grade Corporate Bond iShare) and we have not shown charts of this for recent subscribers. So, we show daily and weekly charts of LQD and TLT below. Fixed income is a tough situation this year, as there could be some changes in performance as sentiment changes. The bottom line for us is that there is some technical evidence that sentiment is moving away from safety plus income, to income with some possibilities for growth.
Commodity Review
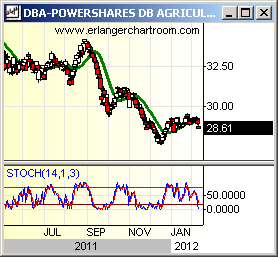
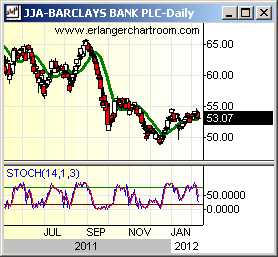
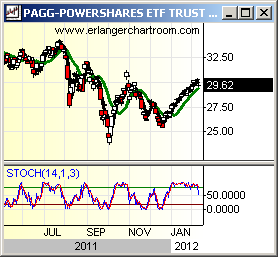
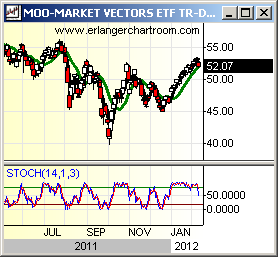
This is almost the seasonal time when the Agricultural commodities generally make a seasonal low, and then start to perk up. So, the trading in the ETFs we follow is interesting – they have started to fall off, and this may be the last decline for several months. We show charts below and give a couple of levels where we would be buyers between here and the end of February. DBA (Powershares ® DB Agriculture Fund): 27.70 – 27, JJA (iPath® AIG Agriculture Total Return Sub Index): 51.60 – 50, PAGG (Powershares Global Agriculture Portfolio): 28.30 to 27.70, and MOO (Market Vectors Agribusiness ETF): 50.20 to 47.20.
Oil is through the winter seasonal period, and is consolidating – but the bellicose commentary out of the Middle East deserves some attention. USO (United States Oil Fund) still looks favorable and a move through 39.20 would be a distinct positive, setting up a test of resistance in the 40 to 41 area. We note that UHN (United States Heating Oil Fund) is trading better, but this is likely a reflection on the cold weather and not international tensions. Still oil and oil stocks look positive to us.
GLD (SPDR Gold Trust) is up and consolidating gains nicely – but it remains overbought and as mentioned last week, a test of 162 is possible. There is some possibility of continued pullback in GDX (Market Vectors Gold Miners ETF) and PSAU (Powershares® Global Gold and Precious metals Portfolio) – we would add to these at 53.40 and 42.30 and note that PSAU continues to outperform. Overall, we remain bullish on commodities and would use weakness to add to positions slowly, for a summer rally.
International Review
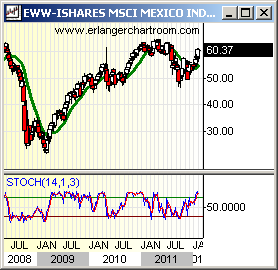
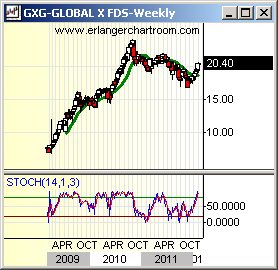
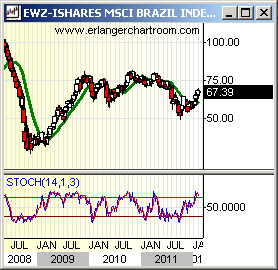
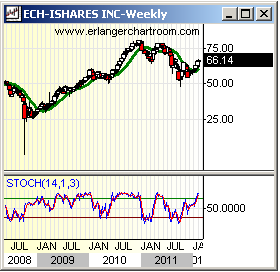
We have not looked at Latin America in a month or so, as Europe has been in the news. As of this writing, Greece has passed the austerity measures and this should benefit foreign markets in the short-term. Long-term we expect the US markets to do better. In last week’s midweek review we showed that Emerging markets have underperformed U.S. small cap, but we could see a quick trade in Emerging Markets, especially Latin America, over the next month. While we prefer the US longer-term, for those who want an aggressive trade or simply have to have an international sleeve to portfolios – these Latin American ETFs should prove interesting.
Our favorites are, in order: EWW (iShares MSCI Mexico Index Fund), GXG (Global X Interbolsa FTSE Columbia 20 ETF), EWZ (iShares MSCI Brazil Index Fund) and ECH (iShares MSCI Chile Index Fund). Some observations: the first is EWW is heavily weighted toward oil, and Mid-East turmoil could benefit this market. The second, and most important, is that EWZ is NOT the best looking of the non-oil related Latin American markets, although it is one of the most popular. Should there be selling in this area later in the year, EWZ may be the most vulnerable. GXG is a recovering country and economy, and ECH is relatively stable and “non-newsy”. We like ECH, in particular, as it is unlikely to be hit first in the event that there is aggressive selling in Emerging Markets later in the year, which as of now, we expect. We show Weekly charts below, and invite emailed questions as needed.
Weekly Chart of Interest
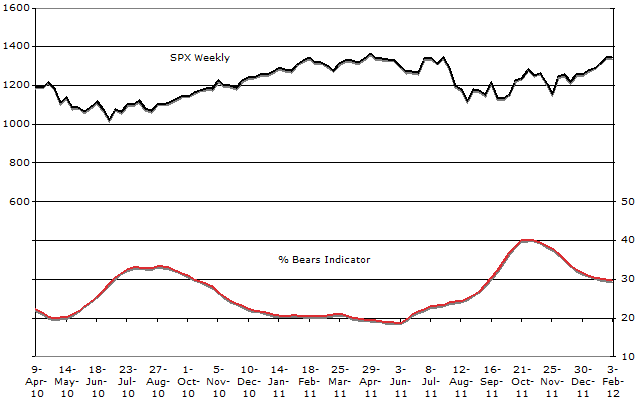
A number of advisors have asked about our Investor’s Intelligence Sentiment indicator, so we show the chart below. We use this indicator as a longer measure of sentiment, because sentiment becomes “embedded” in a market. This indicator has been a reliable measure of intermediate-term market activity, and remains positive. The last time the market was at this level was June 2010, and the indicator was at 20. We refer readers to the Special Research Articles section of the website – there are three articles there on sentiment for those who want to delve more deeply into this indicator.
Member Log In

Who is Fred Meissner, CMT?
Listen here:
The FRED Report is not authorized, endorsed, or affiliated with the Federal Reserve of St Louis and its FRED Economic Data.


