The Fred Report - Weekly April 4, 2011
The FRED Report - Financial Research, Education & Data
Volume 3, Issue 27
Trading Week Starting April 4, 2011
Download PDF Version here
Summary of Market View
The stock market finished the quarter strong, but this moves the monthly indicators up into sell areas. This is in line with what we have been looking for, i.e. a drop followed by a strong second half for 2011.
Bonds look like a rally is likely – perhaps on a market decline. The one exception is the HYG, which looks weak.
Commodities still look to decline into May and then set up for a strong summer rally.
International is interesting. We discuss emerging markets, which have been stronger than forecast and we will look at some of the individual components and they are not as strong.
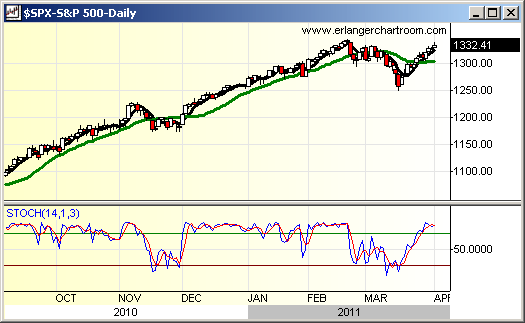
The stock market appeared to close the quarter, month, and week strong, but there were problems with the trading pattern. Please see our Monthly Review, likely out at the close April 4, for more on the longer-term indicators, but to summarize, stocks look to rally a bit more, perhaps through the end of this week (and test 135 or so on SPY). Our other scenario, which we feel is somewhat less likely, would be a pullback this week, and a rally into expiration next week. Daily indicators are somewhat extended, but weekly ones suggest a bit more rally before the overbought nature of our longer-term indicators really takes hold.
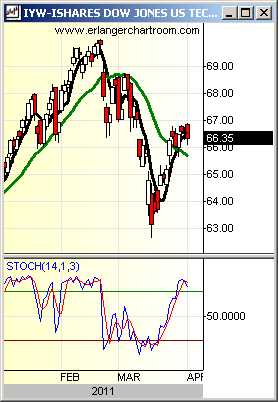
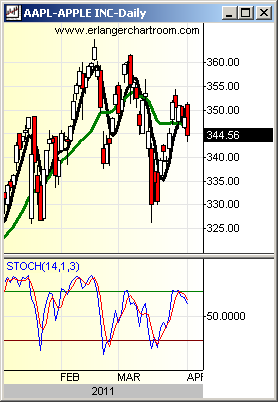
We note there are more and more signs that leadership is changing away from Technology. While we have been expecting this, such leadership change can also be a sign of a short to intermediate-term top. We show charts of IYW and AAPL below. Note how both of these instruments had outside day negative reversals on Friday, even as the market rallied. We again suggest that advisors monitor tech positions carefully, with an idea of trimming this sector if holdings start to misbehave.
A note for traders: we are approaching a juncture where the market could be a decent short. However, we believe that the big trade for 2011 will be buying this decline for second half strength. I am focusing more on that trade than playing the decline.
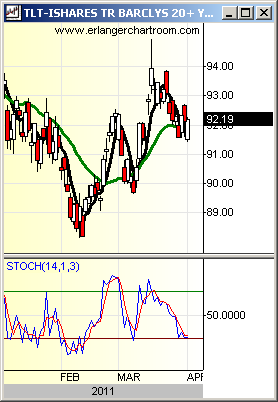
Bonds continue about the same – TLT has got strong accumulation models but is trading weaker than we would like to see. Still, we believe more rally from roughly this 92 – 93 area is possible, and this will likely occur on a market correction into Late May/Early June.
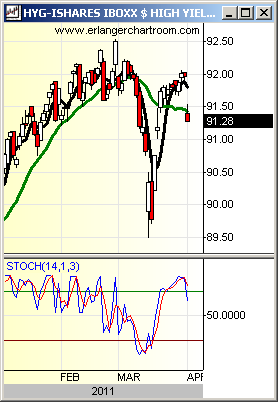
One interesting feature here is that HYG had a very bad day, especially relative to the other bond markets we follow. This could be a “canary in a coalmine” sort of move, as HYG has been a proxy for risk appetite in the markets, and not following interest rates. Should this weakness continue we would be more concerned. We show charts of TLT and HYG below.
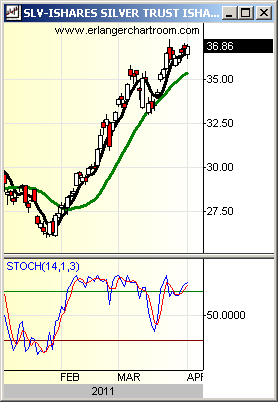
We will discuss the metals this week, as gold and silver both had interesting trading days on Friday. Silver had a nice intraday reversal, but has failed to take out the highs of March 24th, a reversal day as well as the high for the move. The chart pattern looks strong here, but momentum is not confirming, the classic set-up for a decline. Should SLV move back below 35.50 a test of 31 or so would be likely, and should be a buying opportunity.
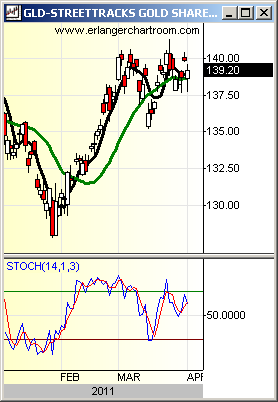
Gold also had a reversal day on March 24th and it was more substantial than the one in silver. This high has not been penetrated either. Until these highs are penetrated we continue to look for a seasonal decline in the metals into a low in late April/early May, followed by a strong second half of the year.
We continue our 14 month target of 152 on GLD, but would like to see the following: First, gold needs to start outperforming silver once again, and second: we expect a seasonal drop in the metals before a really strong rally gets under way. However, as mentioned last week – we want to have positions in these markets as “headline risk” could spark an advance without a meaningful correction.
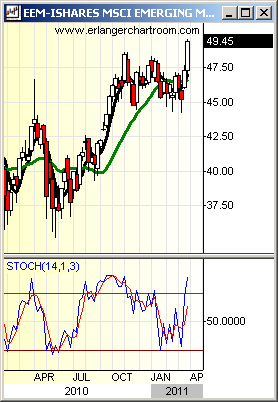
We have had some questions on developing markets, so we look at the EEM (iShares MSCI Emerging Markets Index ETF). When we look at the longer-term charts (see below), we note that the EEM has held support in the 44 area, and has rallied sharply. This sharp up-move has mitigated some of the underperformance relative to EFA and SPY over the last few months. This move has not generated sufficient relative strength yet to cause us to change our views on relative weakness of EEM vs. SPY, but if it continues it may cause us to change these views.
We note, however, that EFA (iShares MSCI EAFE Index ETF) lags the SPY. We feel that this will remain intact, and the lag may even accelerate if our forecast of a weakening Euro and turmoil in the Eurozone continues. A sign of this would be the FXE trading down through 140 to the 139 area. We will devote some space in the midweek to the FXE and EFA.
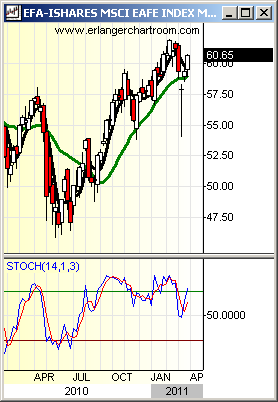
Weekly Chart of Interest
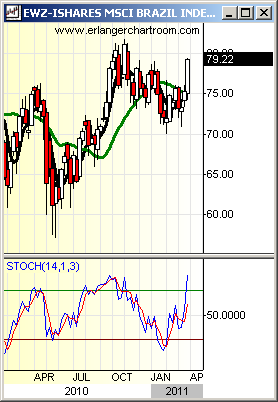
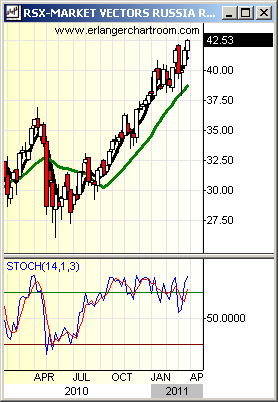
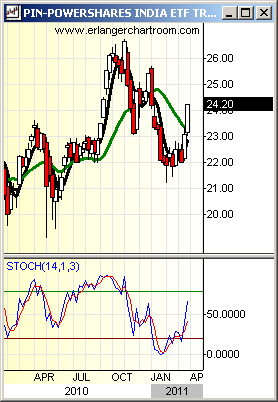
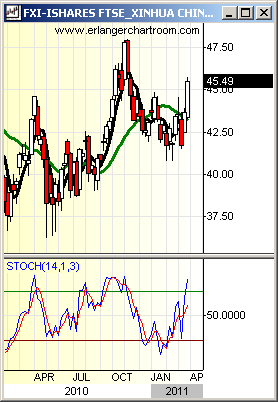
We show weekly charts of the BRIC markets – the first time we have done this in a while. Note that RSX is the only strong uptrend – the other indexes have put on strong moves, but they remain below their November highs.
