Search the Site
The Fred Report - Weekly August 8, 2011
The FRED Report - Financial Research, Education & Data
Volume 3, Issue 63
Trading Week
Starting August 8, 2011
Download PDF Version here
Summary of Market View
(WE ARE TRAVELING IN THE WEST, AND WILL RETURN EMAILS AS WE CAN).
The markets have fallen more quickly than expected, but have gotten down into areas we thought could be tested. Friday’s S&P downgrade news is important, but is likely factored in. For this reason we would expect a rally after a down open on Monday.
Bonds have started to decline and this news may cause treasuries to decline further. But since this type of downgrade has never really happened before we are in uncharted territory. For this reason, we will attempt to be flexible and will write more about this in the Wednesday Midweek.
Metals have surged in recent days and gold has hit our targets of 1690. We have lightened up and moved our opinion to an underweight despite it moving above $1700.
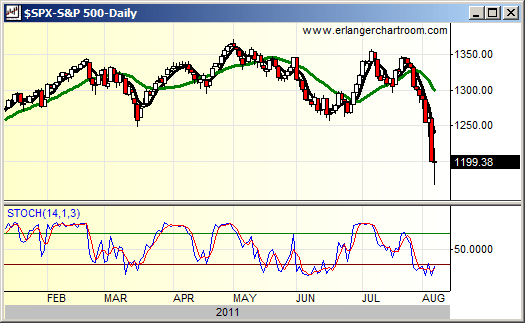
Last week’s market was weaker than we thought it might be. We had mentioned on our weekly Thursday conference call that we thought a test of the 117 area on SPY was possible over the next few weeks, and this happened within a few days instead. Obviously there are questions about whether this is the start (or end?) of a bear market. We prefer to think of these things in terms of trend, and to that end we note that the five day moving average is below the twenty day moving average, a sign of a downtrend. This occurred on July 28 at the 130 area and was one reason for our caution. Until the five moves back above the 20, the trend will remain down, albeit oversold, suggesting higher than average risk in the markets.
With regard to the oversold, we note a few things. First, the daily FPO has hit -19, and -20’s are rare. This suggests a bounce is due, especially when combined with a weekly FPO of -13. The downside momentum has, however, set one of our divergence bottom signals in place – but barely. This suggests that before a real bottom is in place, price will have to make a lower low and momentum a higher low – in other words a retest that breaks the closing lows we have made or will make. This often takes up to two months to develop. An example of this is SLV recently, and also the pattern from the crash of 1987 – when the closing low on the market was December of 1987, although the price low was October. We recently wrote a piece on that: www.thefredreport.com/articles/weekly_midweek_062911
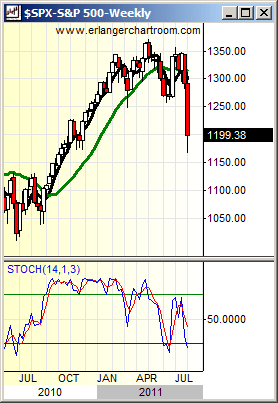
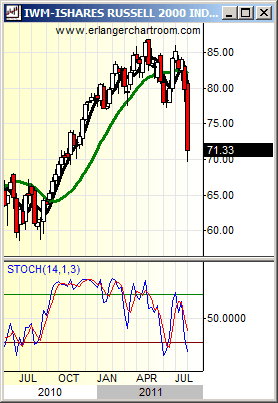
Still, looking at the indicators, our best guess is a rally after this down open overnight based on news (which is not a huge surprise and may be factored in). We think the SPY can test the 122 – 125 area or possibly higher over the next few days/week. This would be enough to relieve the oversold readings and enable the markets to test down once again. We have oversold readings, but not enough to generate an intermediate buy signal. We show weekly SPX and IWM charts below.
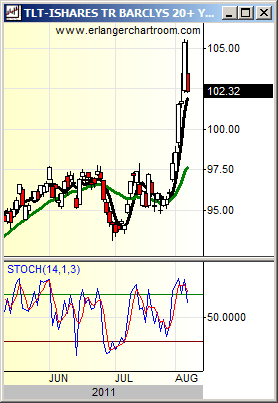
Bonds were all down in Friday’s session before the downgrade, and while they are up in the night session, I would actually expect them to trend down from this general area. Obviously, the downgrade will affect these markets – so we will write a bit less on bonds than we would normally do, and see how this shakes out over the next few days. Normally when the market moves down, bonds have been moving up because they are “safe” – but the downgrade actually means they are less safe – and they may be sold off.
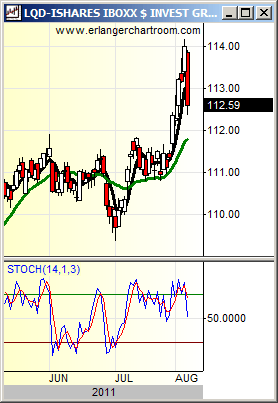
We continue to recommend corporate bonds, and while they also came down the longer-term charts of LQD look much better.
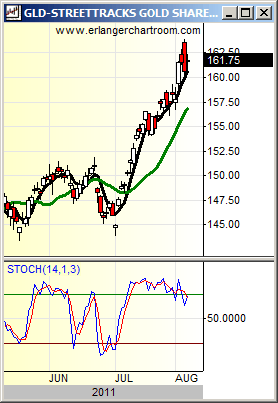
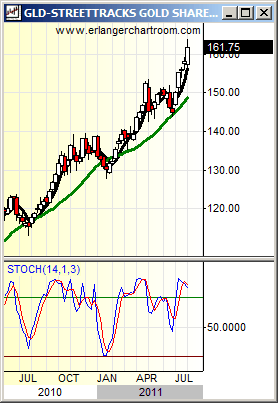
e continue to like commodities and think they will outperform into the end of the year. However, Comex Gold got to with 4 points of our ten month target of 1690/oz during the last day session, and has moved over 1700 in Sunday’s evening session – so we move officially to an underweight in the metals. We have further upside targets and will evaluate these and report them in the midweek – but we would lighten up on longs as a sharp drop and consolidation could occur at any time.
Oil is coming down as well, and this should open down and rally into the end of the week along with stocks. Readings here are very oversold and we note that products such as heating oil are outperforming the regular oil ETFs.
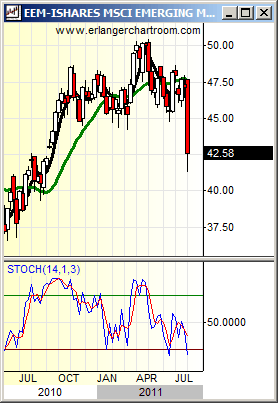
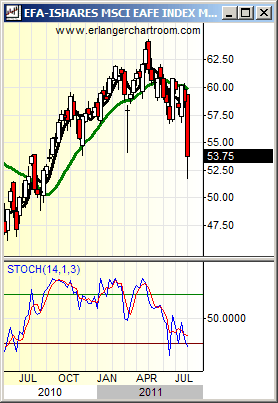
We show weekly charts of EEM and EFA. EFA seems stronger to us than EEM, as noted in previous letters. However the weekly stochastics on both of these (as well as the US market) have a bit more to fall before we hit the 20 area again. This suggests that we are not oversold in spite of recent price action. So, short-term indicators are oversold enough to bounce, but then further declines area possible.
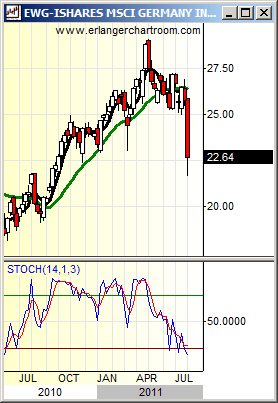
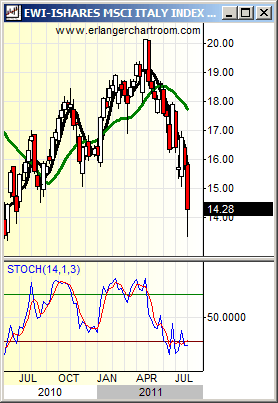
In past letters, we have emphasized moving money into the developed markets rather than the developing, and these charts bear this out. We would further refine that to the strongest countries such as Germany and Sweden, and avoid Italy and Spain, as we have been suggesting. This seems to be working for us, and should these debt issues continue this should be even more important. Readers can see a chart of EWG and EWI illustrates this, in terms of relative performance, and this could actually widen over the next few months.
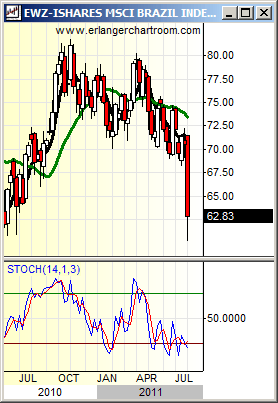
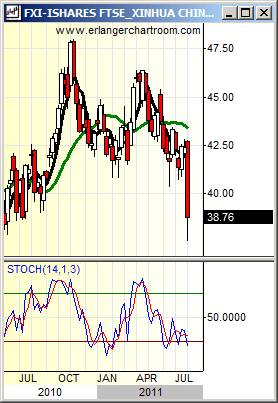
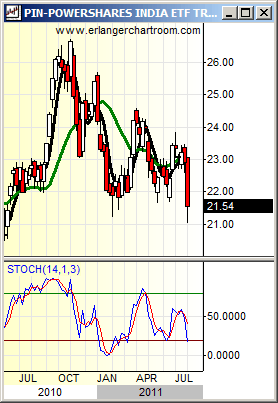
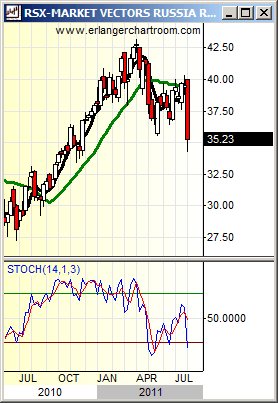
We show weekly charts of the BRIC countries to give an idea of how the recent declines have affected these markets. These have done worse than the US and developed markets. This could continue for a few months, and we will look at them periodically. In particular, we believe in natural resource stocks and markets, and while these are correcting (especially EWZ and RSX) now, this should change by the end of the year.
Member Log In

Who is Fred Meissner, CMT?
Listen here:
The FRED Report is not authorized, endorsed, or affiliated with the Federal Reserve of St Louis and its FRED Economic Data.


