Search the Site
The Fred Report - Weekly March 4, 2019
The FRED Report - Financial Research, Education & Data
Volume 11, Issue 15
Trading Week Starting March 4, 2019
Download PDF Version here
Summary of Market View
In Equities, we discuss New Highs/New Lows and our major trend system. This is neutral to bullish on a trend basis. We also look at “Growth vs. Value”. In Fixed Income, we look at our interest rate indexes. We continue our discussion of rates in “Chart of Interest”, with a discussion of bond sentiment.
In Commodities, we look at the Soft Commodities, as they are important to the outlook for Emerging Markets, which we have favored over the past few months. In International, we look at China. We are concerned that even though longer-term indicators have turned the corner, the short-term picture may be a “sell on the news” set up.
Stock Review (Back to top)
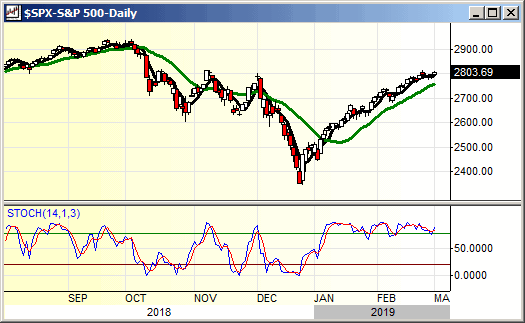
SPY has slowed in the area around 280 and we have seen some new low expansion, one of the factors we are looking for to suggest this rally is ending. We note that the expansion is, so far, not significant enough to worry, but rather is something that we will monitor. Another caution flag is that major trend systems on IJR (iShares® Small Cap 600) and IYT (iShares® Dow Jones Transportation Index), the two economically sensitive components of our trend following model, remain negative. The two broad market indexes, SPY (SPDR® S&P 500 Trust) and ONEQ (Fidelity NASDAQ Composite Tracking Stock ETF), remain positive. So, our official intermediate market stance remains neutral. For new advisors, we use trend following systems on the four indexes mentioned above as a key ingredient to determine our market stance. In most instances, these go negative at different times. In 2015 IJR went negative in the summer and by November all were negative, forecasting the decline in early 2016. Now, only two are negative, and ancillary indicators are still mostly positive. Some more upside is possible here, and we continue to hold our investment positions.
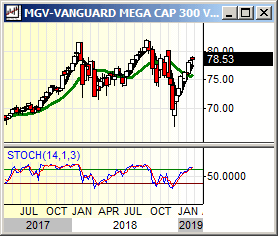
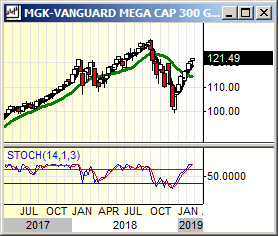
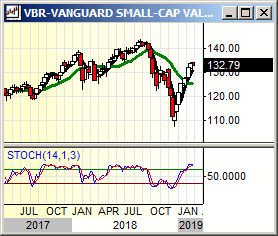
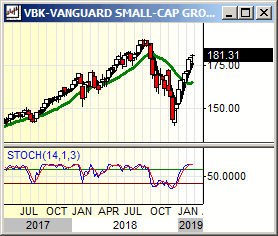
Today, we will look at our “Growth vs. Value” indexes. These are: MGV (Vanguard Mega Cap 300 Value Index ETF) and MGK (Vanguard Mega Cap 300 Growth Index ETF) for large cap, plus VBR (Vanguard Small Cap Value ETF) and VBK (Vanguard Growth ETF) for small cap. There are still signs that Value is gaining on Growth. In past articles, we have indicated that the switch from Growth to Value often is first visible in the small cap indexes. So it is in this instance. Note that the chart pattern on VBR relative to VBK is superior relative to that of MGV and MGK. VBR made new highs at the end of last year while MGV basically double topped. However, this is not as strong as it could be, especially in the first part of this year. VBR is 7% from the 2018 high, while VBK is 4% away. Contrast that with MGV at 4% from that high vs. MGK at 3%. This data is interesting and mixed. We still think it shows that Value is beginning to win, and it suggests that smaller large cap issues may be where the action turns out to be. It also suggests that the last couple of year’s strong growth names should be evaluated, as their time for leadership has likely passed. We show weekly charts, below, and suggest looking at all of the timeframes.
Fixed Income Review (Back to top)
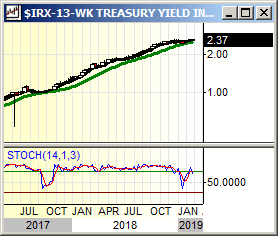
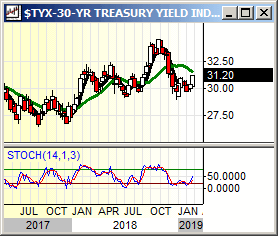
We are seeing some signs that interest rates should rally over the next few months, and bond prices decline. TLT has failed at intermediate resistance and may be breaking down below important support at 119. We will look at our interest rate indexes in this article, and bond sentiment in “Chart of Interest”. We will look at IRX (CBOE Short-Term Treasury Index), FVX (CBOE Five Year Treasury Index), TNX (CBOE Ten Year Treasury Index), and TYX (CBOE Thirty Year Treasury Index) here in this section.
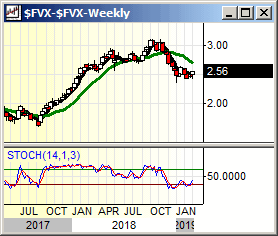
We will look at the weekly charts, and what we are seeing is that the ten and thirty year rates have started to move up, more than the five and one year rates. But, all of these are in bases and look to be starting advances, except for IRX – the shorter-term rates (these have continued to advance, while the others pulled back, and actually are flattening out for now). FVX has support in the 24-area, and resistance in the 25.50 to 26-area. Through this would target the highs in the 30 area. The weekly stochastic has recycled, and price is at a much higher level than the last recycle, suggesting an uptrend is in effect. This is a positive chart.
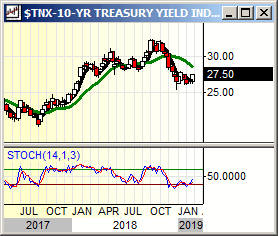
TNX is showing a bit more breakout potential. Support is 25.50, and resistance is 28.50, then 31.50. The weekly stochastic is recycled and in buy mode, and the monthly is close to a recycle. TYX is the most important of these, as these rates are more subject to market forces and less to government policy. This is a breakout above the 30.50 area, which is similar to the resistance holding the other units. Next resistance is 31.50, then 33 and then new highs for this move. We would also look at the monthly chart on these units, and the monthly chart on TYX is especially strong, although the stochastic has not recycled. This is a base above a base, and while this pattern could go on for a while it is unlikely to end up lower, instead suggesting gradual acceleration. We show weekly charts, below. Advisors should at least look at the monthly charts, but really should look at the daily charts also.
Commodity Review (Back to top)
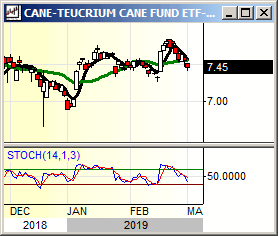
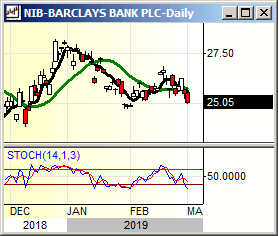
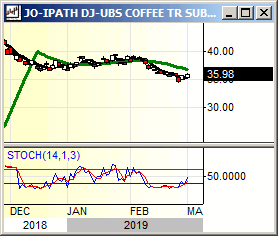
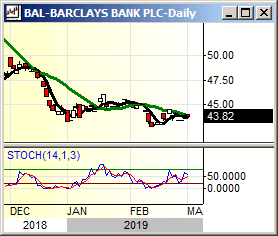
We have not looked at the Soft Commodities in a while and will do so here. While these are not popular with some of our advisors, they are used by some and are interesting indicators for the economy, and also for Emerging Markets. Today we will look at CANE (Teucrium Sugar Cane Fund), NIB (iPath® Dow Jones-AIG Cocoa Total Return Sub Index ETN), BAL (iPath® Dow Jones-AIG Cotton Total Return Sub Index ETN), and JO (iPath® Barclays Coffee Total Return Sub Index ETN). Note that some of this series of ETN have been taken over by Barclays and while they track the same commodity, they are relatively new and do not have the same amount of chart data.
While we will look at these individually, the most important thing is that they are similar patterns, and relatively flat, suggesting price stability. CANE is a base between 6.50 and 8.50 or so. The daily stochastic is in sell mode, and the weekly is overbought – it has not yet turned down but looks like it should. However, the monthly is a buy recycle, suggesting this base should ultimately resolve to the upside. CANE is important to Emerging Markets. NIB is also important to Emerging Markets. It is less attractive than CANE, and the daily and weekly stochastics are in sell mode. Support is 24.80 to 24 and could be challenged this month. Resistance is 27.50 to 30, and then 35 is major supply. The trades up there likely were the result of weather or a shortage. This should come down a bit more, we will have to see if it can hold support. JO is another Emerging Market related commodity. This is interesting because support at 35 broke but has revalidated. Since this has been weak, it is not surprising that the stochastic pattern is still negative on the weekly, but it is a buy recycle on the daily so there may be a quick rally here. Resistance on JO is 37.50 to 39. This ETF has less data as Barclays has taken over. Those who decide to trade this should sell this if it makes new lows. Last is BAL, which has also completed a successful test of support at 43 or so. The weekly stochastic is still negative, but the daily is up and this and CANE are the two most appealing of the softs. Note that BAL is another one of the Barclay’s charts and may not be as robust. It also has new crop/old crop issues. We would not trade this one. We show daily charts, below, due to the Barclays issues.

International Review (Back to top)
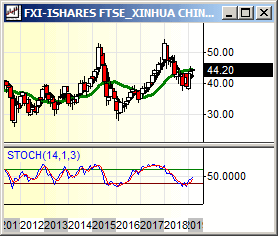
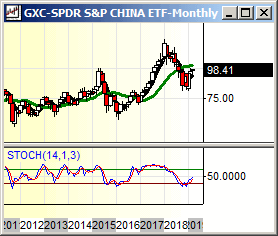
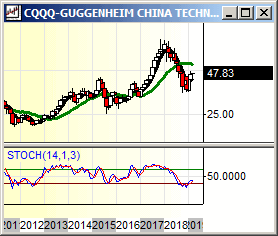
We are now in March, and this is an important time for the Chinese trade talks. So, let’s look to see if there is anything to be gleaned from the Chinese ETFs. We will look at two conservative, and two aggressive Chinese ETFs. These are FXI (iShares® FTSE Xinhua China 25 Index ETF) and GXC (SPDR® China ETF), plus PGJ (Invesco® Golden Dragon Portfolio) and CQQQ (Invesco® China Technology ETF). There are more Chinese ETFs we follow, but these are representative and should give a comprehensive picture.
First we look at FXI – the most common Chinese ETF. We have mentioned that it is also one of the worst performing units, as it has not exceeded the 2007 high. It has support from 40 to 38, and resistance at 45 or so is being tested. Beyond this is 50-area resistance. Stochastics are in sell mode on the daily and overbought, turning down on the weekly. GXC, on the other hand, has penetrated the 2007 high, although it has pulled back below it. Support is in layers from 90 to 82, and resistance is 102 to 108. Stochastics are similar to FXI – the daily is in sell mode and the weekly is overbought and starting to turn down.
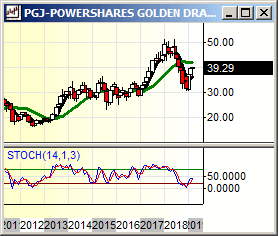
The more aggressive ETFs are CQQQ and PGJ. CQQQ has a strong chart, with support from 40 to 36, and resistance is 52 to 56. Stochastics are in sell mode on the daily and overbought on the weekly such that this could pull back on a China trade deal, and then resume an uptrend. It has exceeded the 2007 high by a good margin. The only problem with this is that it does not provide broad based exposure to the Chinese economy. Right now, Tech is attractive, but this could change. For this reason, we have preferred PGJ. It is a similar chart, and it does have Tech in it, but it is more diversified than CQQQ. PGJ has support in the 32-area that has held, and resistance is 40 to 42. We averaged into this last year, and the average price for advisors is likely 42. The daily on PGJ is in very slight sell mode, while the weekly is overbought and has not turned down. There are strong intermediate buy signals on all of China, as the monthly stochastics have buys recycled on these ETFs, but they all suggest the possibility of a “sell on the news” decline is possible. We see no reason to alter our recommendation of part GXC and part PGJ at this time.
We show monthly charts, below, and suggest looking at the other timeframes.
Weekly Chart of Interest (Back to top)
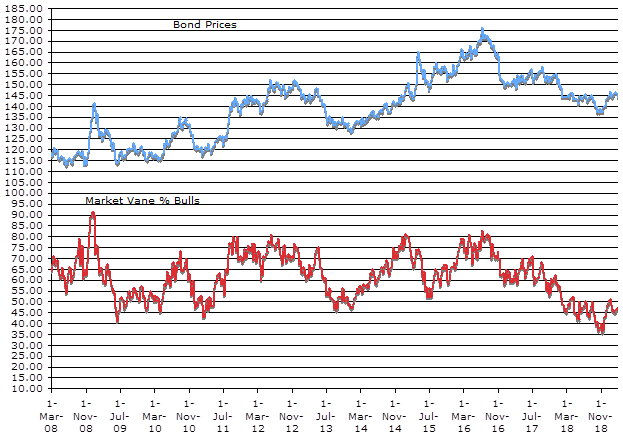
We show bond sentiment from Market Vane. This is a %bulls rather than %bears, as we follow in equities. It is still fairly low, around 46% bulls. This is a positive that could support bonds remaining in some sort of range. If this sentiment suddenly shoots up without a corresponding move in bonds, then we would have concerns.

Member Log In

Who is Fred Meissner, CMT?
Listen here:
The FRED Report is not authorized, endorsed, or affiliated with the Federal Reserve of St Louis and its FRED Economic Data.


