Search the Site
The Fred Report - Weekly February 19, 2019
The FRED Report - Financial Research, Education & Data
Volume 11, Issue 12
Trading Week Starting February 19, 2019
Download PDF Version here
Summary of Market View
This may be the “oil issue”, as we discuss the Oil Stock ETFs in the Equity section and then the Oil Commodity ETFs in both the Commodity section and Chart of Interest.
In International, we discuss Emerging Market ETFs. These remain our favorite international area to invest, but an actual advance may take a bit more time to get underway.
In Fixed Income, we discuss Emerging Market Bonds, as the Dollar Denominated ETFs have started to perform well as the dollar has improved, and look much stronger than they did at yearend, when we last covered these.
Stock Review (Back to top)
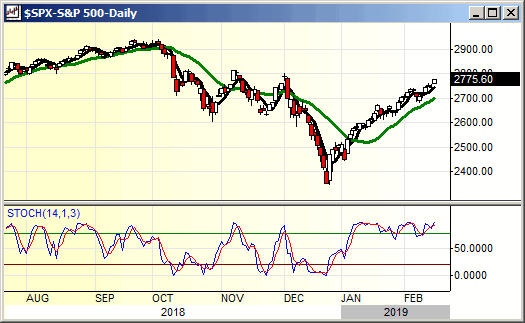
Stocks were up for options expiration last week, and new lows did not expand, suggesting this rally may have a bit more to run although indicators are overbought. We will stay with RSP in portfolios for now, although we note that low volatility stocks are also doing well – SPLV has made an all-time closing high.
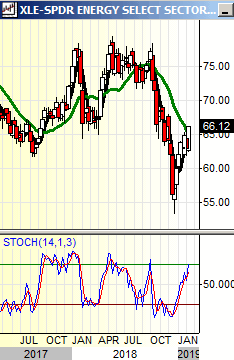
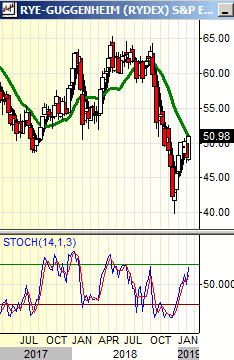
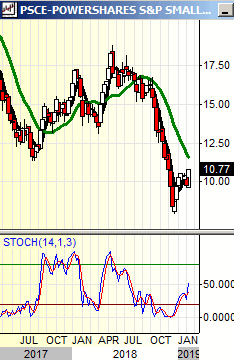
We have had a number of questions about energy stocks, and will discuss some of these ETFs here, and in the Sector Report, due out this week. We also discuss the Petroleum Complex in the “Commodities” section, and in “Chart of Interest.” These are all interrelated. The three ETFs we will discuss here are XLE (SPDR® Select Sector Energy ETF), RYE (Invesco® Equal Weight Energy Index), and PSCE (Invesco®® Small Cap Energy Sector ETF). These are the main broad-based ETFs in Energy.
We discuss XLE in the Sector Review, so we will take just a little more space here. XLE is in one of the weaker relative sectors this year, but it is on a monthly buy recycle, and daily and weekly stochastics are overbought. The chart pattern is similar to USO, discussed in the “commodities” section, below. Resistance is from 67.50 to 70, and support is 60 to 55. The biggest problem we have with XLE is the heavy weighting toward CVX and XOM. XOM is not trading well and this could be impacting performance.
Let’s look at RYE, our favorite in the broad Oil Stock ETFS. While the pattern is similar to XLE, in many respects this is a stronger chart. It has a monthly buy recycle, and support is 42 to 36. Resistance is 24 to 60. Above that would target 66 and through that could challenge the 72-area. The weekly stochastic suggests some more upside, although the daily is overbought. We would use this in lieu of XLE.
The most interesting of these, as well as the riskiest, is PSCE. This is weaker than the prior two, reflecting the weakness in small cap in general. This is the only one of these that made new lows vs. 2015 on the last decline, but it is above this low now. It may be a cutout low, and for speculators this is a good opportunity. The monthly stochastic is turning up, but not yet a recycled buy, while the weekly is up and suggests there is more to go. The daily is just overbought and has not yet turned down. Support is the low at 7.97 (really 8), and resistance is 11.50 or so. All of these should be up for another few weeks, and then negative seasonal tendencies might kick in. We show weekly charts, below. Also, please look at the daily and monthly charts.
Fixed Income Review (Back to top)
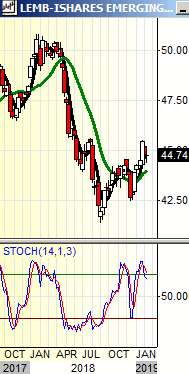
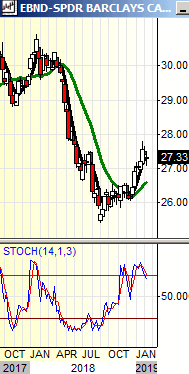
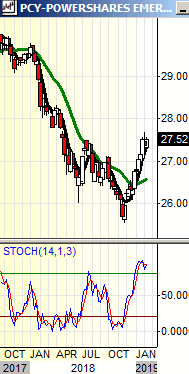
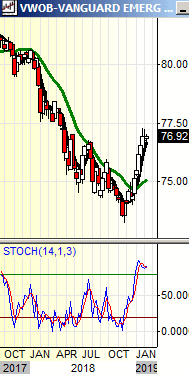
On last week’s conference call, we discussed the potential for dollar strength, rather than weakness as I discussed in my yearly forecast. If we have such strength, one area that may be impacted is Emerging Market Bonds. The last time we discussed these we recommended local Currency Bond ETFs – but given dollar strength we should look at these again, and also at some of the dollar denominated units. So, we will look at LEMB (iShares® Emerging Markets Local Currency Bond ETF) and EBND (SPDR Barclay’s Capital Emerging Markets Local Bond), our two favorite local currency Bond ETFs. For dollar denominated units we will look at PCY (Invesco® Emerging Markets Sovereign Debt), and VWOB (Vanguard Emerging market Bond ETF Dollar denominated).
First, let’s look at the local currency units. We like LEMB and EBND the most of the available choices. Of these two, LEMB has the most upside potential, while EBND is a smoother trend. LEMB has support in the 43.20 to 42.30 area, and resistance is 45.50 to 46. The daily stochastic is in sell mode, and in the 20’s, suggesting an advance soon, and the weekly is overbought and almost a sell recycle. Ideally, this chart will build a consolidation in this area and then advance again but note that it has pulled back over the last two weeks as UUP picked up steam. EBND is similar, with support at 27 to 26.50, and resistance is 28 to 29. The daily stochastic is oversold, below 20, but has not completed a buy recycle. The weekly is just below 80, a sell recycle that suggests a bit of weakness to come.
Second, let’s look at the dollar denominated ETFs. PCY is our favorite, as it is a concentrated portfolio, with a higher yield. PCY has support at 27, and resistance is 28 to 28.50. The daily stochastic is in sell mode, while the weekly is overbought but not near sell mode. This is a strong chart. VWOB is also strong, but slightly less so than PCY. It has support from 76 to 75, and resistance is 77.50 to 78.50 or so. The daily stochastic is also in sell mode, and the weekly is similar to PCY, up but again, slightly weaker. The yield on VWOB is slightly less than PCY, and the chart is a little less robust – so PCY is our favorite, but we could use either of these for exposure.
I’m glad we decided to do this analysis, because the dollar denominated units have done much better than we thought they would do when we looked at them in late December. Indeed, these look as if they could start to outperform the local currency units. We would consider adding these to existing positions to diversify the currency exposure. We show weekly charts, below, and suggest readers look at the other timeframes also.
Commodity Review (Back to top)
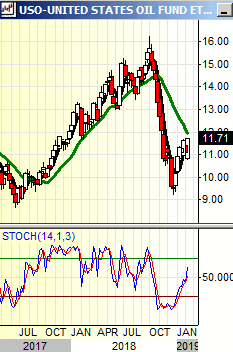
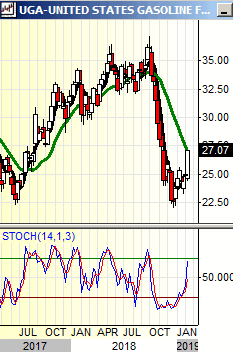
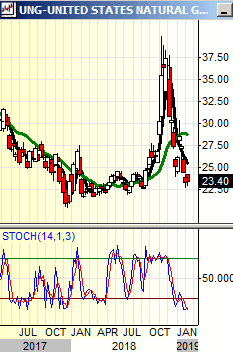
The Petroleum Complex is approaching the end of the seasonally strong winter period, so we look at the trend of these units here in this article. There are several oil ETFS, but the most common is USO (United States Oil Fund). We will also look at DBO (Invesco® DB Oil Fund). For Gasoline we will look at UGA (United States Gasoline Fund), and for natural gas we will look at UNG (US Natural Gas ETF). In Chart of interest, we will look at our perpetual oil contract, and discuss why it is a better representation for oil.
First, let’s look at USO. This ETF has support from 10.50 to 10, and resistance is from 12.50 to 13. The daily stochastic is up but not quite overbought, and the weekly is up and midrange, suggesting a bit more upside is possible. We show our perpetual oil contract in the “Chart of Interest” section at the end of this report, and readers can see that it has performed better than USO. Why is this? Well, oil is the only common commodity that has monthly contract expiration. USO rolls to the front, or nearby month each time expiration occurs, and this affects the price. Traders, of course, realize that USO buys the front month, so there is a distortion. One way around this is the optimal roll strategy used by DBO. DBO uses an algorithm to decide which of the oil contracts is the best, and then rolls to that one as others expire. This has several benefits, but these two are the most important. First, since the contracts roll less often, price differences between contracts mean less. Second, since market makers in oil do not know when DBO is going to roll, it can do so at better prices. These two things add about 1.5% to the performance of DBO.
Second, let’s look at UGA, our favorite trader in the Petroleum Complex. UGA has an overbought daily stochastic, and a weekly stochastic that suggests more to go on the upside. Support is 25.50 to 24, and resistance at 27 to 28.50 is being challenged. This chart looks tradable on the upside, as 28.50 should be tested. Above 28.50 would challenge the 30-area and we would consider sale at that point, or whenever the daily stochastic moves into sell mode. This is the strongest looking of the Energy ETFs.
The most interesting ETF in this area is UNG, as it has been volatile, with support at 22 and resistance from 26 to 28. This had been in a base for a while, then broke out of that base and tested 40, where it failed. The daily stochastic is oversold and not in buy mode, while the weekly is oversold after a failed buy signal. In some respects, UNG is a low risk buy here, as below 22 would stop out of the trade – but the trade does not look like it is going to work! Below 22 would target 20 or below.
All of these suggest a bit more upside in oil, as we move into the end of the seasonally favorable winter period. We would be careful of these if the weekly stochastics roll over. We show weekly charts, and of course suggest looking at the perpetual oil contract in the Chart of Interest section of this report.
International Review (Back to top)
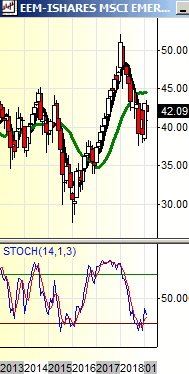
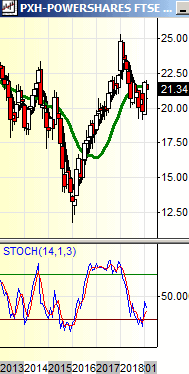
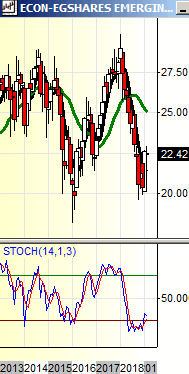
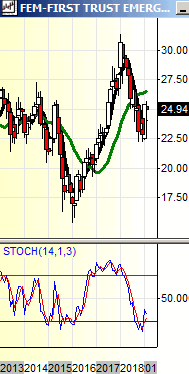
On last Thursday’s conference call, we spent some time talking about Emerging Markets and their attractiveness vs. the dollar index, which we are concerned could extend last year’s rally into the first half of this year (in contrast to our yearly forecast that suggested a weak dollar in the first part of the year). While this could have a short-term effect on emerging markets (EM), the longer-term technicals on EEM and others still look positive overall. We will look at several Emerging Market ETFs, but the bottom line is that we would use short-term weakness to buy EM, and this still looks like a bottoming process although it could take some more time to run. We will look at EEM (iShares® MSCI Emerging Markets Index), PXH Invesco® FTSE RAFI Emerging Markets), ECON (DJ Emerging Markets Consumer Titans), and FEM (First Trust Emerging Markets ETF).
EEM is the primary ETF and index for emerging markets. In this article we will look at the monthly charts for these units. It has support from 37.50 to 32, and resistance is 45, then 47.50. The monthly stochastic has just moved into buy mode, while the weekly is a sell recycle such that some pullback should occur over the next few weeks. Our favorite of these is PXH, a stronger chart. This is a fundamentally weighted deep value selection that has outperformed EEM at key times, notably off the last major bottom in Emerging Markets. PXH has support from 19.50 to18, and resistance is in layers from 23 to 25.50, then new highs and a breakout could result. The monthly stochastic is a buy recycle, and the weekly is overbought and trying to turn down but is not a sell signal yet. The daily is oversold, and almost in buy mode although it has not done a complete recycle. The stochastics are stronger than EEM, but the pattern is similar. ECON was a favorite for a while, but the pattern is weaker now, as the chart has retraced more on the monthly than PXH. Support is 18, and resistance is 24 to 26. The stochastic pattern is the same but a bit weaker on the monthly. We include this chart simply because we have used it in the past – we would not use it now. The last one of these we look at is FEM. It has support at 22.50 and resistance is 27 to 28.50. The stochastic pattern is similar as well, but a bit weaker than PXH.
These ETFs look like they are in bottoming patterns and work we did back in November suggested that these could take several months to actually complete a bottom and start to advance. These charts suggest that this process is moving along, but that there should be another decline before it has ended. This decline should hold the lower band of support and should be bought. We show monthly charts, below, and suggest looking at the other timeframes.
Weekly Chart of Interest (Back to top)
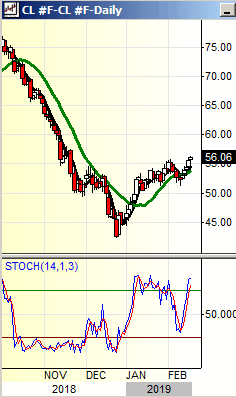
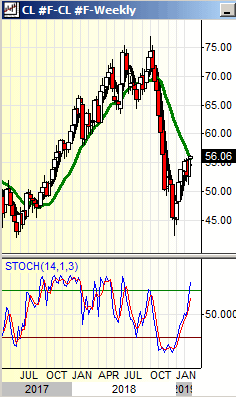
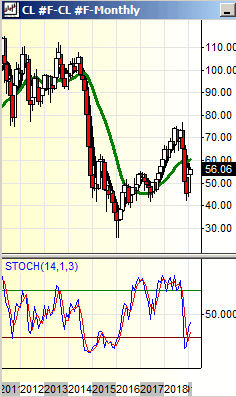
We show our perpetual contract for oil. The reason we use a perpetual contract is that it provides continuity in price in spite of the monthly expiration of the actual oil contracts. To form a perpetual contract, prices are adjusted, and then connected together. We use this excellent website for commodity charts and quotes is: http://futures.tradingcharts.com. Readers can look at this site and see what prices are by contract month for all commodities, as well as charts of individual contracts. We discussed our price target of $72 to $76/Bbl for oil in our yearly forecast, and this remains our forecast. It should be hit by this summer, unless oil falls below support at $48. The next short-term resistance is 64 to 66. The daily and weekly stochastics suggest there is some more upside, but we would be cautious on the next sell indication as favorable seasonality is ending. We show charts, below.
Member Log In

Who is Fred Meissner, CMT?
Listen here:
The FRED Report is not authorized, endorsed, or affiliated with the Federal Reserve of St Louis and its FRED Economic Data.


