The Fred Report - Mid Week Update August 8, 2012
The FRED Report – Financial Research, Education & Data
Mid Week Update
Volume 4, Issue 64
August 8, 2012
Download PDF Version here
Update of Market View
Stocks have continued their rally so far this week, and our forecast is for the market to be strong into the end of August. We have had a number of questions and will deal with the most popular question below.
First question: is the market factoring in QE3, which some firms suggest will happen in Mid September, and is that the reason for the current rally? Our answer: We do not believe QE3 will happen until after the election. We believe the market is rallying into the end of August, for seasonal reasons, as forecast.
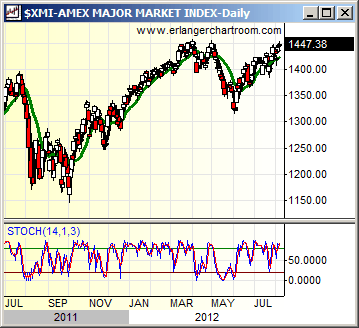
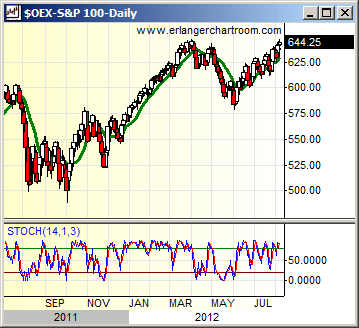
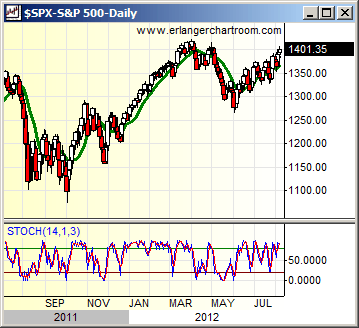
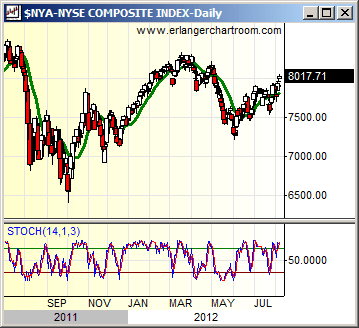
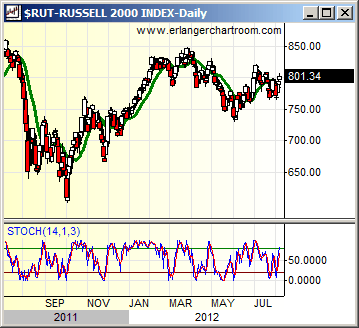
Second: there is a great Standard and Poor’s article suggesting the market is giving out more bullish signals, moving average crossovers, and such. We will deal with this more fully on Thursday’s call, but our answer is that market structure is NOT improving as some indicators go positive. These indicators are going positive late in the move as well which is almost always a bad sign. We show charts of this by looking at daily charts of XMI, OEX, SPX, NYA, RUT (Russell 2000) . Readers can see that XMI and OEX are outperforming SPX, and NYA. SPX and NYA are outperforming RUT. This means the market is narrowing in favor of large cap stocks, which is traditionally been the precursor to a decline of magnitude. Readers should look at monthly charts of these as well, to get more of a feel for this type of action. We acknowledge that this situation can be reversed without an appreciable decline, and certainly hope that we are wrong about a decline after August, but note that many of the classic signs of a weakening market are present.
Our strategy has been, and remains, the following: First, look at portfolios with the idea of selling weak, underperforming names and cycling into something like SPLV or at least leading stocks. We will stay with, and re-evaluate the market at the end of August – this month should be the best of this summer rally and while we are overbought there is no sell signal – and we are not sure how high we can go by our “sell date” of August 31, when our summer rally forecast officially ends, and we evaluate it.
Other Points of Interest
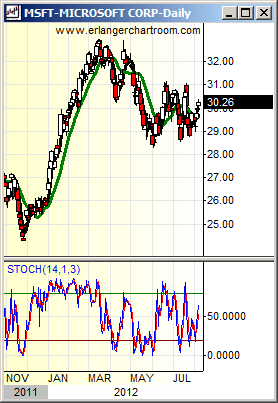
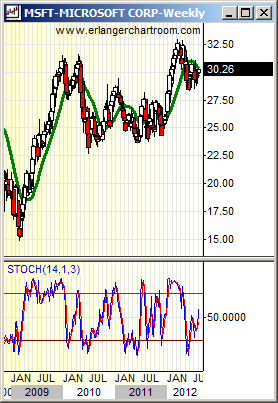
We show charts of MSFT. There have been a surprising amount of questions on this stock, which has support in the 29 area and could test 31, then 32.50 by the end of August, especially if the market is strong. This stock is improving slightly, but is basically weaker than something like INTC, which has started to advance and is a stronger chart.
