Search the Site
The Fred Report - Mid Week Update June 8, 2011
The FRED Report – Financial Research, Education & Data
Mid Week Update
Volume 3, Issue 46
June 8, 2011
Download PDF Version here
Update of Market View
Tuesday’s market was better than it appeared to be, at least on first glance, and this means that the week has a better tone to it than most market observers are suggesting. We discuss positives and negatives below.
First, Tuesday’s breadth was positive while prices closed negative. This is often the precursor to a sharp rally. Second, Tuesday’s market exceeded Monday’s low at the end of the day – and since most markets that open up after a big down day do this either right away, or in the next few days – the action at the end of the day eliminated some “reserve” selling pressure. While there are some negatives (and we will discuss these in the following paragraph), we still see the possibility for an up week – our thought is a down open tomorrow, followed by rally into Friday. Expiration week could then see more correction.
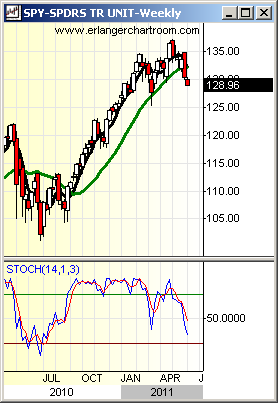
In terms of negatives, the main things we see are more for the end of June, after an intervening rally. The first concern is that weekly stochastics have started down, making new lows vs. the bottom in March due to the quake. This could imply that stochastics move all the way down to the 20 area on the weekly. Should this happen, the market could easily challenge the 125 – 122 area. The Monthly indicators imply a drop into the end of June as well. Daily indicators, while oversold, do not have buying patterns on them, suggesting resolution of the daily oversold followed by more decline is certainly possible. All of this points to a low at the end of June/early July unless the tone of the market improves quickly.
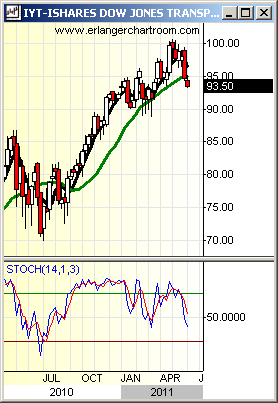
We show two weekly charts, below: the SPY (SPDR S&P 500 Trust) and IYT (iShares Dow Jones Transportation Index). Note how the stochastic on IYT is stronger as it is above the March low. This is a plus, as it suggests the economy is a bit stronger than the consensus – but it is likely not strong enough to suggest this is the end of the correction.


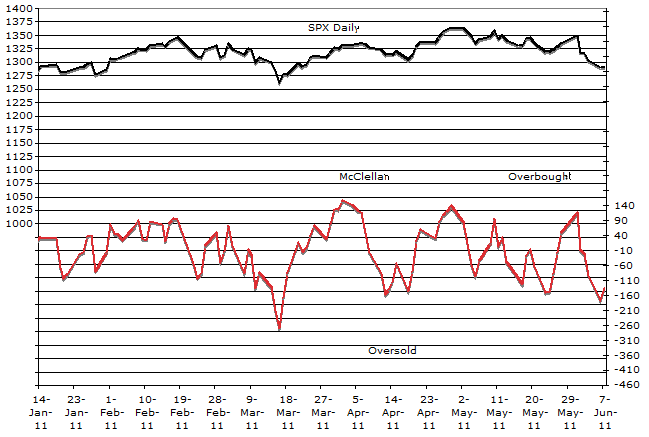
We show the chart of the McClellan Oscillator. Note the McClellan has come down to support and is turning up – suggesting a short-term rally is possible. Our concern remains, after indicators such as this become neutral to overbought, that another leg down could ensue.

Member Log In

Who is Fred Meissner, CMT?
Listen here:
The FRED Report is not authorized, endorsed, or affiliated with the Federal Reserve of St Louis and its FRED Economic Data.


