Search the Site
The Fred Report - Weekly November 16, 2015
The FRED Report - Financial Research, Education & Data
Volume 7, Issue 85
Trading Week Starting November 16, 2015
Download PDF Version here
Summary of Market View
We were looking for a down week last week, and this has occurred, although prices have fallen a bit more than we expected. We discuss this and how to treat this market closer to option expiration for November. In Bonds, we look at TLT, but also at Preferred Stock ETFs. We have not reviewed these in detail in some time, but Preferreds are a bright spot in the fixed income rubric.
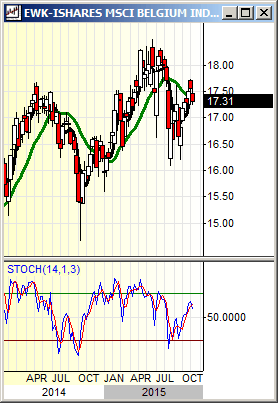
In Commodities, we check on oil, DBC, and GLD. These markets are behaving badly, and could cause considerable problems for worldwide equities. We follow this in the International section with discussion of China and some buy recommendations there. This is the area of biggest risk for stocks, in our view. In Chart of Interest we discuss France and Belgium as these markets could have sharp declines early in the week, but should be bought if this occurs. We give some numbers.
Stock Review
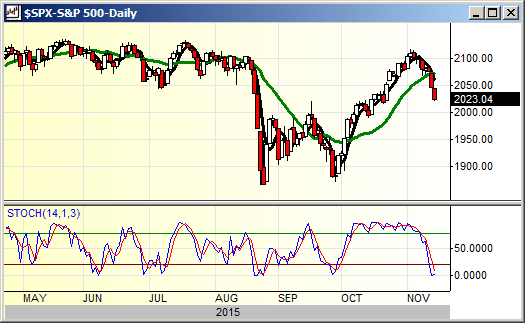
Stocks had the down week we were looking for last week, and while prices went a bit lower than we thought they might (and yes, that IS a concern), the daily stochastic is now below 20, the weekly FPO has fallen from +15 to plus 1, and in these and other ways the overbought condition has been relieved. New lows expanded, but this is not unusual on a down week, and we may have seen enough pullback of the advance from 190 on SPY to suggest consolidation and another rally attempt. Recall that, on the rally through 205 back in October, that we suggested some whipsaw moves around 205 could occur, and to be vigilant. So, there are two questions to answer. The first is, “Is the rally from 190 over and should we hedge?” Our answer to this is so far, at least, no. Recall that we have only added two thirds of the money raised so we have a third to add when the coast is clearer. This gives us some flexibility and we answer the second question below.
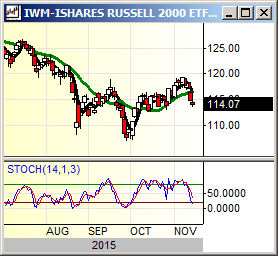
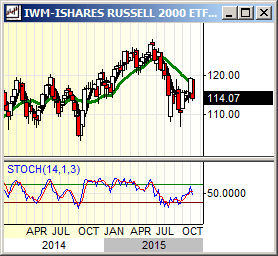
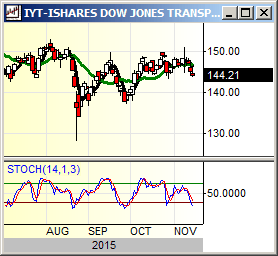
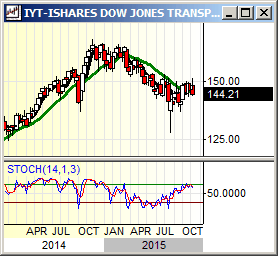
How exactly will we know we are wrong about this, and what sort of action do we expect this week? Ideally we would see the market open down Monday, trade sideways, and recover during the day. Then after more choppy action we should see a close above 205 at the end of the week. Friday the 20th is option expiration for November, and this alone creates the possibility of volatile trading and whipsaws. Patience and sagacity will be rewarded, and a close below 198 on SPY will tell us if we are wrong. We show IWM and IYT below – and ask that you compare them with the chart of SPX in the summary section and also that weekly chart. These have lagged a good bit on the last rally, and if we are right and SPY moves back above 205 hopefully the market will broaden out and these will perform well. Some of this depends on the commodity markets – please see Commodities, below.
Fixed Income Review
TLT has rallied a bit off of an oversold condition, which is not a surprise. But it is now a rally in a confirmed downtrend, as the last spike high at 126 was lower than the previous high, and the low was lower than the previous low as well. We continue to feel that treasuries will continue to decline, up into the Federal Reserve (FED) meeting in December. They should discount the results of their moves.
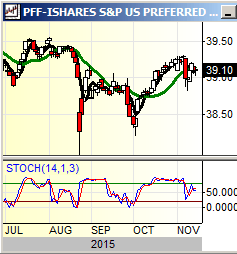
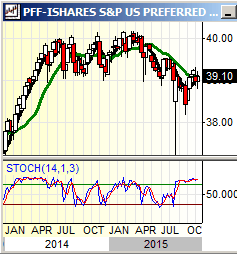
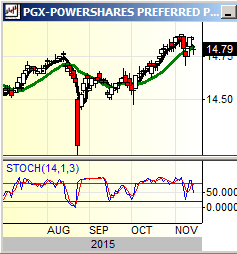
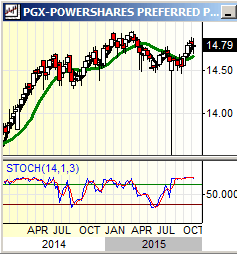
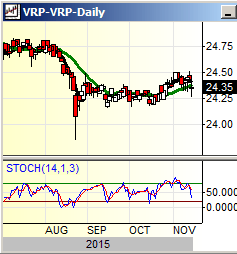
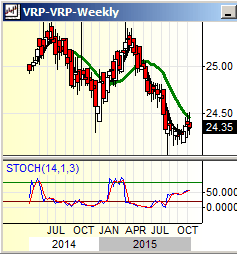
There are other instruments in fixed income that are performing better and we have looked at these over the last few months, in these reports. This week we will mention the Preferred stock ETFs that we follow. All of these are appropriate to use as part of a fixed income model. We follow PFF (iShares® Preferred Stock ETF), PGX (Powershares® Preferred Portfolio ETF), and VRP (Powershares® Variable Rate Preferred Portfolio ETF). Right now we are using PGX in models, and may end up with VRP if PGX starts to act badly when the FED starts raising rates. They are trading in very stable fashion and should outperform TLT if rates rise slowly, as we expect.
Commodity Review
In the commodity markets, our biggest concerns are being realized, and we could see still more weakness and deflation over the next few weeks, unless oil can close back above 42.60 on our perpetual contract. It is at $41.44 this morning on the Paris news so there is less than a one dollar to go. We mentioned in last week’s letter that if we were wrong about oil holding, now would be the time and it is trading more weak than we would like to see given the indicators. While the daily stochastic is now oversold, there is risk that oil will break 40 and trade to 32. If this happens, we have concerns on China and the equity markets as well. We have said that we believe China and commodity deflation is the elephant in the room with regard to the equity markets, and continued weakness here could lead to further correction.
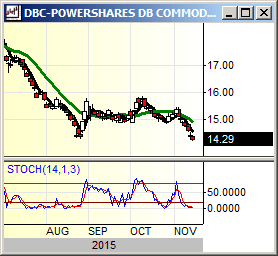
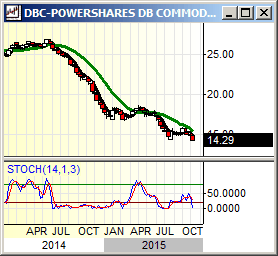
We mentioned DBC last week, and it has broken to new lows, a move suggesting that this is a kick off move to the downside for commodities, unless it can move back above 15 by the end of the week. This could be a negative for China (see the International section) and we will just have to see how this works out. It could be a false breakout, and if so there will be a good buying opportunity on a close above 15.
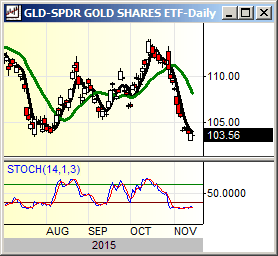
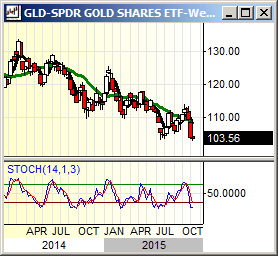
Gold now has a different pattern relative to DBC and oil. While we are not sure what this means, trading it is formulaic. The daily chart of GLD is a spike bottom with an inside day (an inside day is when the high is lower, and the low higher, than the previous day). The correct method to trade this is to buy above the high of the spike bottom day, and sell on a stop below the low of that day. Or do the reverse if the low is penetrated first. We will watch this carefully as it may provide some clues for the direction of the markets.
International Review
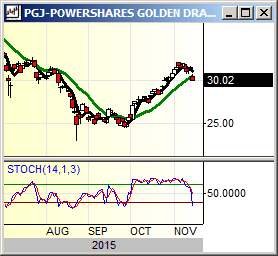
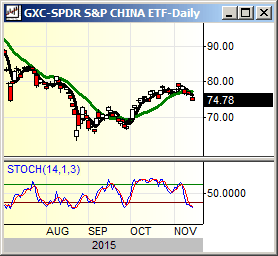
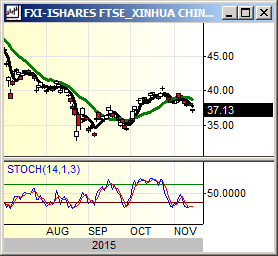
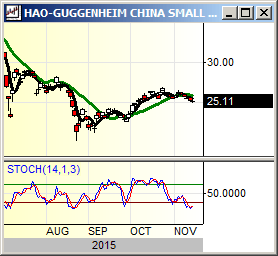
We are seeing the first pullback of the Chinese markets since the August/September bottom. We believe that this is in response to the weakness in commodities, and are concerned that this move could get out of control to the downside more easily than most suspect. We thought that China had bottomed but failure to hold this week would be a concern. We follow four Mainland Chinese ETFs: PGJ (Powershares® Golden Dragon Portfolio), GXC (SPDR China ETF), FXI (iShares® FTSE Xinhua China 25 Index ETF), HAO (Guggenheim China Small Cap ETF) and they are listed in order of technical strength. We look at these, below, and note – we would consider swapping FXI for either PGJ (our preference) OR GXC but not HAO. PGJ should hold 28 or so on this decline, and GXC should hold 72 to 70. Below these numbers would be a concern. FXI looks worse and if it does not hold 36.50 might test 34 or even make new lows if China continues to weaken. HAO, small cap China, needs to hold 24. If not, 22 or lower is likely.
One other concern that bears mentioning: according to some of the news reports we have seen, Japan is now officially in a recession as of this morning. This is the strongest part of Asia, at least in terms of stock prices. This could very well be an outgrowth of a Chinese slowdown, and a concern for the rest of Asia going into 2016. We show China, below, but will cover Japan if need be in the Midweek Review.
Weekly Chart of Interest
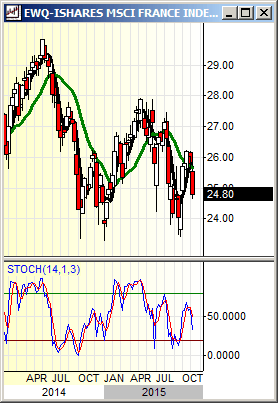
We have not looked at EWQ and EWK is a while, but the recent horrifying events in Paris suggest taking a look. Both of these look to pull back a bit more, and then could be bought (although we are staying with EWL, and EWGS for now). We would try to buy EWQ at 24.50, then again at 24. We would buy EWK at 17.15, then 16.80. We show weekly charts, below.
Member Log In

Who is Fred Meissner, CMT?
Listen here:
The FRED Report is not authorized, endorsed, or affiliated with the Federal Reserve of St Louis and its FRED Economic Data.


