The Fred Report - Weekly September 27, 2010
The FRED Report - Financial Research, Education & Data
Volume 2, Issue 77
Trading Week Starting September 27, 2010
Download PDF Version here
Summary of Market View
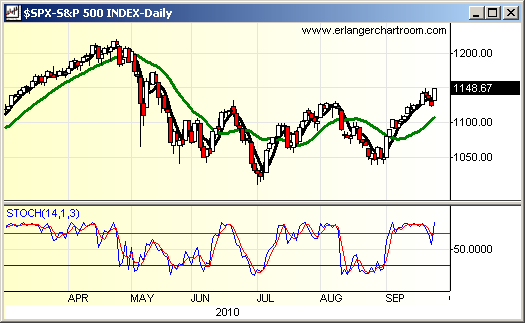
The stock market continues to rally and while we have some overbought short-term indicators (see stochastics on chart below), intermediate-term indicators suggest higher prices into at least the end of the month and possibly more. In addition, moving average systems remain positive.
Bonds have rallied back to resistance and we continue to look for rates to rise into fall. This needs to start soon, however, and indicators are mixed.
Commodities should rally a bit more and we remain long-term commodity bulls, but these markets look a bit tired and seasonally could correct a bit into the fall. We advocate using this drop to add money to this area.
International markets look like more upside is possible and these markets continue to look more attractive, on a chart basis, than U.S. markets.
Stock Review
The stock market closed out last week strong. One question several subscribers have asked is: are we happy with the action? To answer that let’s do some review. First, back in July we mentioned we have a signal that suggested the SPY would close out the period July to September 30 on the high for the move. So far, this is happening, and we continue to expect a strong close to the month. We will have to look at the indicators again as of September 30, but if Friday were the end of the month we would be in okay, but not great, shape.
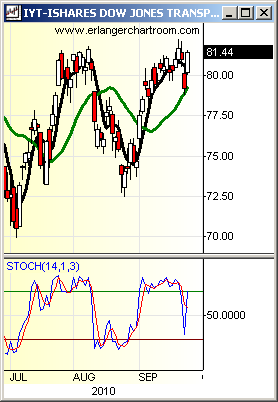
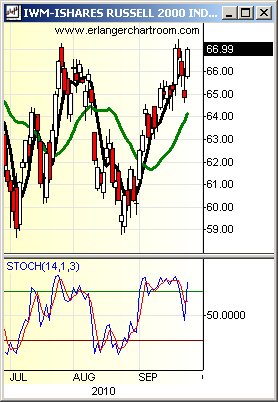
Breadth indicators continue to look good, and weekly indicators are not super overbought – they have more to run. We are concerned that the Transports (IYT - iShares Dow Jones Transportation Index) are lagging the market, but note that leading sectors are performing well. Even lagging sectors such as Healthcare and Financials are rallying. Overall, the quality of the rally is okay. Small stocks are lagging, but even here the IWM (Russell 2000 Index iShares) has a bottoming formation, not a topping formation –it is just lagging. We show charts of the IWM and IYT below.
Should this rally end we would expect to see a gradual, rather than sharp drop – so for now sharp drops are bullish and should be bought.
Fixed Income Review
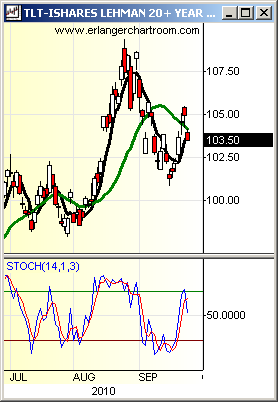
The TLT (Barclays 20 Year Treasury Bond iShare) has rallied to test the 106 area once again and is failing. We continue to believe that rates will rise into the fall, but in order to feel more sanguine about this the TLT needs to break the last set of lows (100.85 on September 16). Our accumulation model did not rally with the bonds, but at the same time has not broken down, so this market is up in the air.
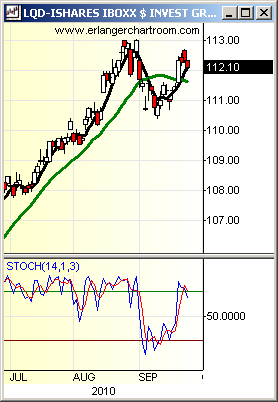
LQD (Investment Grade Corporate Bond iShare) continues to look more attractive for investors and for more risk oriented bond investors a look at the HYG (High Yield Corporate Bond iShare) makes sense. A move above 90 on HYG would suggest continued rally, which would also imply less credit concern in the overall economy. Right now this looks possible, but subscribers should not jump the gun unless they are willing to use stops to manage risk.
Overall, bonds continue to test key areas. Many think that for the stock market to continue the rally bonds have to drop but we are not so sure, and that is NOT what our models are saying.
Commodity Review
The commodity markets continue to be mixed here. We maintain our target of 130 on the GLD (SPDR Gold Trust) but are not impressed with the trading here, and suggest snugging up stop losses in the event of a surprise.
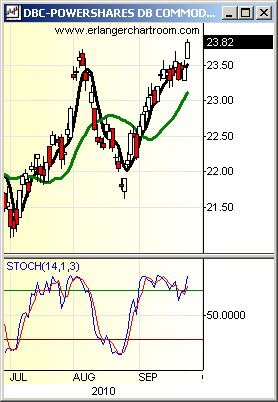
The DBC (Powershares DB Commodity Tracking ETF) has staged a short-term breakout, suggesting that our target of 25 should be tested in the next few weeks.
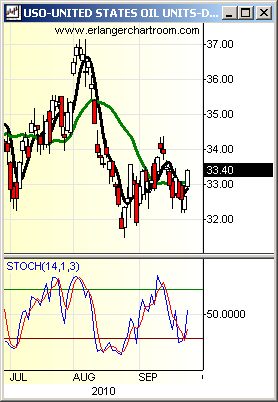
USO (United States Oil Fund) is stabilizing which is contributing to this advance, and it should continue to stabilize even if there is no significant rally until the late fall, when seasonals kick in.
Overall, we have no change in opinion on commodities.
International Review
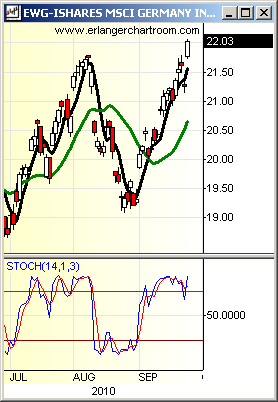
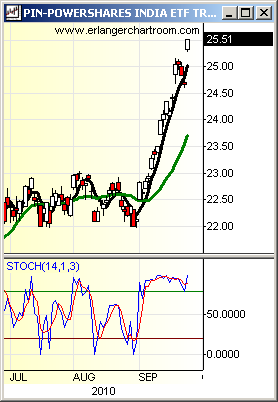
International markets continue to look much better than their U.S. counterparts. This is everything from the EWG (iShares MSCI Germany Index Fund) to the Indian markets (our favorite unit is PIN: Powershares India Portfolio). Japan and China also look strong.
The FXY (Rydex Currency Shares Japanese Yen Trust) has rallied back towards the 117 area and should we be right about a correction here. This market should fall off this week.
The FXE (Rydex Currency Shares Euro Trust) has been strong and the dollar weak, but this may change as the dollar is right on support and the Euro at resistance. If we had a big Euro position we would start to take some of it off in here.
Overall, again, no opinion changes here.
Weekly Chart of Interest
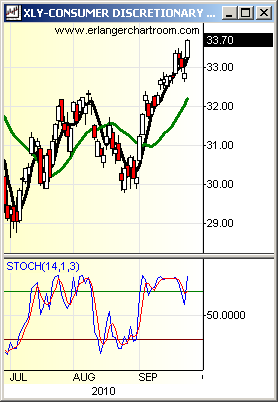
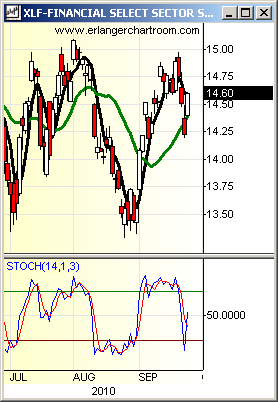
We show charts of the XLY (SPDR Select Sector Consumer Discretionary ETF) and the XLF (SPDR Select Sector Financial ETF). We note that while both of these look like bottoming, and not topping formations, the XLY continues to lead. We tend to favor stocks in the XLY and not banks or other financials found in XLF.
