Search the Site
The Fred Report - Weekly August 23, 2010
The FRED Report - Financial Research, Education & Data
Volume 2, Issue 67
Trading Week Starting August 23, 2010
Download PDF Version here
Summary of Market View
Once again, we acknowledge that if we are going to be wrong, now is the time. That said, it looks as if we are set to rally and challenge the resistance in the 114 area on SPY. Should we go through 114 we could have significant upside. Should the market fail again either there, or at this area, 950 to 900 on the S&P 500 on the downside cannot be ruled out.
So far, we have been wrong about bonds, but we remain cautious. They are near resistance.
The seasonally favorable period for oil is ending, and commodities could start to lag.
The dollar looks to rally a bit, and the Yen decline.
International markets on the whole look better than their U.S. counterparts.
Stock Review
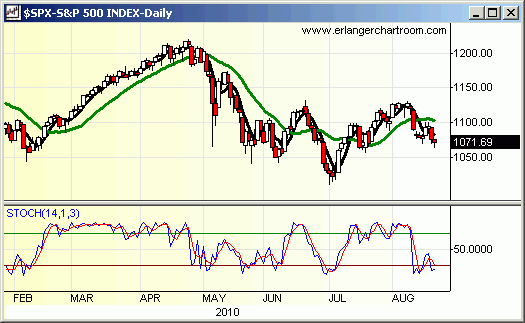
The stock market came down into the 1070 to 1080 on the S&P 500 we had been looking for to set up another short-term buy. The gap at 107 on the SPY is filled as well. Last week was options expiration, so choppiness and erratic trading occurred and was not a surprise. What IS interesting, given the violence of the decline, was that weekly NY Advance/Decline figures were positive, and NASADAQ figures were only slightly negative.
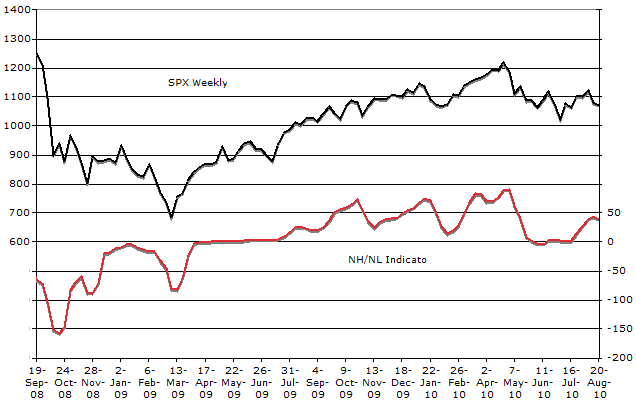
We had questions about the New Highs/New Lows numbers and these remained positive as well – we show our NH/NL indicator in the Chart of Interest section.
There are some concerns, mostly that our accumulation models on the SPY and QQQQ are lagging the market and at resistance. This can, and would likely be, changed if the market can rally here – but if it does not trade well this rally, should it occur, could give way to a more significant decline.
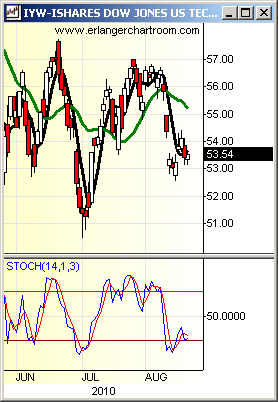
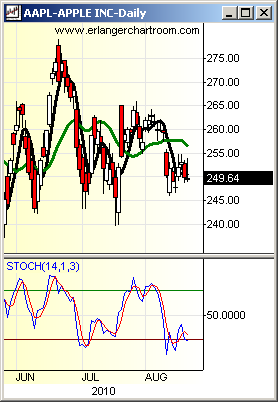
Our sector report is coming out later today, but there are some notes from that report we wish to highlight. First, we continue to see strength in Industrials and Materials. Such strength would be unlikely if the economy was going to weaken from here. Second, financials continue to look weak and even if they should rally, unless the XLF can make it through 18, this remains an underweight in our work. Third, the Technology ETF (IYW) looks weak, but that may be because of Apple (AAPL). Tech stocks themselves look better than the ETF.
Fixed Income Review
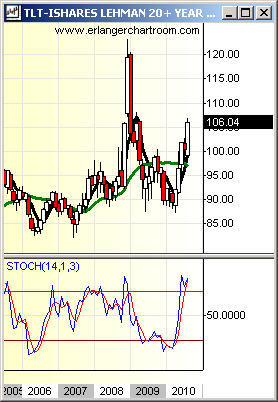
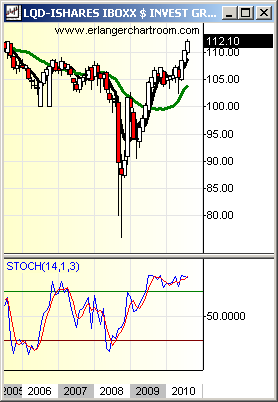
The bond market continues to move up, but now my accumulation model is starting to lag. The FPO (Fred’s Price Oscillator) on the TLT is close to the sell area. I would continue to emphasize the LQD over the TLT for now, and remain cautious on bonds in general.
We note that the LQD is at resistance at 112 on the monthly chart, and the TLT hits resistance at 108.00. Our concern remains that this market is getting frothy and could drop abruptly. We have been wrong on this market so far, but remain concerned that we are peaking in here, and could drop sharply into the fall. Let’s see how this week works out – right now both TLT and LQD are up on gaps, and these could fill.
Commodity Review
The commodity markets have traded back down into support and the seasonally favorable period for oil is fast coming to an end. This suggests that commodity and related stocks may start to under perform from now into fall. Agricultural commodities look a bit better than the energy complex and for commodity exposure the two ETFs we mentioned last week (and which got us into Barron’s! http://online.barrons.com/article/SB50001424052970203662204575421321947710514.html ) – Dow Jones UBS Grains iPath TR Sub Index ETN (JJG) and Market Vectors Agribusiness ETF (MOO), look better than the energy complex.
We are very interested in the JJG I would have positions in these, but be circumspect as they also have a tendency to peak in the fall.
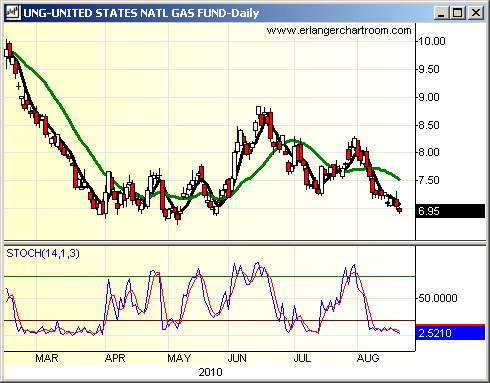
Natural Gas has broken down through the 7.00 area on the United States Natural Gas (UNG) but not by much. A move below 6.75 would concern us, otherwise this is okay, and a move up towards the 7.75 to 8.00 range is expected. Unlike Crude, this market can trade up into winter from here as demand for natural gas grows with the commencement of the heating season.
International Review
International markets are interesting here. First and foremost, the Dollar looks to have held the 80.00 area and could test 85 or higher. Note that the weekly stochastic on the buck has moved down into the buy zone. If this trade is to work on the upside, now is the time.
In turn, the Japanese Yen Trust Currency Shares (FXY) is giving some selling indications and could fall to the 111 area without too much of a push. That would be a normal pullback in an uptrend, but should 111 break a move to 107.50 could occur. This would be good for Japanese stocks. When we turn to the Japan Smaller Cap Fund (JOF) we note that it is right on support and the weekly stochastic has come down enough to make this interesting on the long side. It is in buy mode, having moved below and then above 20.
The Euro Trust Currency Shares (FXE) could weaken a bit, but not too much in here – maybe to 123.00.
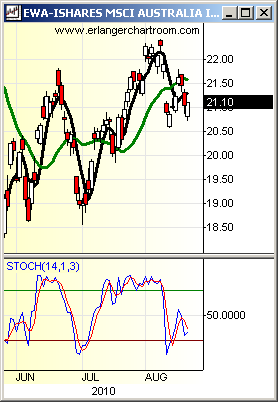
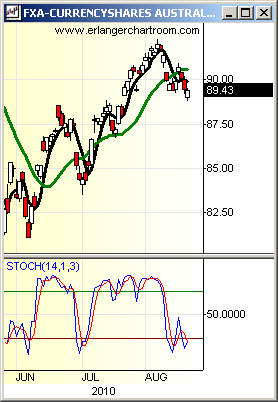
A quick note on Australia, as there is some political stuff going on there this weekend. The MSCI Australian iShares Index (EWA) has experienced a minor correction in line with other equity markets and looks poised to advance as well. So does the Australian Dollar (FXA). From this I would guess that this political news is good for Australia, and Asian markets in general. We also note that BOTH of these ETFs look stronger than the SPY at this juncture.
Weekly Chart of Interest
We had questions about the breadth in general and New Highs/New lows in particular, so we show our New Highs/New Lows indicator. While the market has corrected a bit, this indicator has hardly budged. It remains in a bullish configuration. Recall that this indicator has a long lead-time, so it looks a bit more bullish for the long term.
Member Log In

Who is Fred Meissner, CMT?
Listen here:
The FRED Report is not authorized, endorsed, or affiliated with the Federal Reserve of St Louis and its FRED Economic Data.


