The Fred Report - Weekly May 23, 2022
The FRED Report - Financial Research, Education & Data
Volume 14, Issue 39
Trading Week Starting May 23, 2022
Download PDF Version here
Summary of Market View
In Stocks, we discuss improvement in the internal indicators on SPY over the last week, and the successful test of the bottom end of our projected target range. This suggests a market rally should occur into Memorial Day – a traditionally strong period for equities. In Fixed Income, we discuss the bond indicators we mentioned last week, and then move into a discussion of inflation-protected bonds. We give two ETFs for that area.
In Commodities, we look at some of the oil sub sector ETFs, in response to questions on last Thursday’s conference call. We would continue to use our recommended strategy, which we also describe in this section. In International, we look at some Asian alternatives to China and Japan, although these markets are looking interesting here. Last, in Chart of Interest, we show Fred’s Volatility Indicator. It also supports a trading rally here.
Stock Review (Back to top)
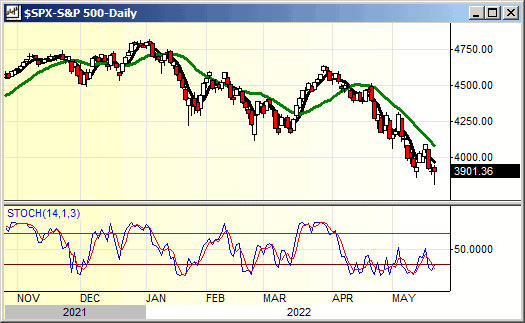
There has been enough improvement in the internal indicators to suggest an imminent rally. In addition, SPY came very close to my downside target of 380 and rebounded from this level. We need to talk for just a minute about targets. While these are useful, and we have had success with them, how the market acts as targets are approached is vitally important. So, since we have seen improvement in the indicators at the forecasted price, we have to be positive here. We have done several pieces on sentiment over the last couple of months, and while Put/Call still has not spiked, overall sentiment is still negative enough to allow for a rally. So, we expect a rally at least into the end of this week and are still looking at the 420 to 440-area as possible. Momentum indicators then suggest another decline is likely after this rally (assuming it occurs). One other quick note: this should be a “fits and starts” advance, and not a “whoosh” to the upside. That would be much better trading. Also, note that from the standpoint of our internal indicators, this has been the best the market has looked in a while.
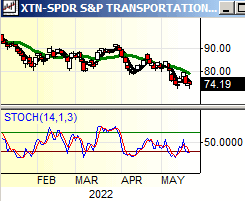
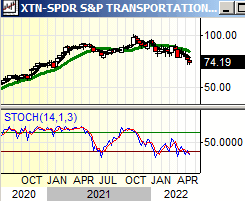
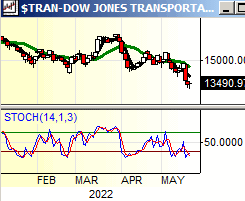
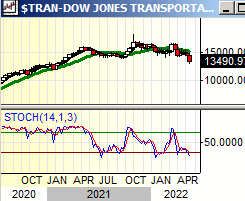
On last Thursday’s call we were asked about the best indication for further major decline in equities and we suggested watching the Transportation indexes. We discuss our reasoning here, as well as the main Transportation Indexes. For us, the Transports are the most important indicator for the economy. So far, these are holding up reasonably well on a chart basis. Our favorite Transportation ETF is XTN (SPDR® S&P Transportation Index ETF), because it is broader than the Dow Transports, and is equally weighted (the Dow Transports is a price weighted index). The other index we will look at is the Dow Jones Transportation index. IYT (iShares® Transportation ETF) is popular, and was a proxy for the Dow Transports, but iShares® has changed that ETF and made it less useful for analysis, so we will not look at it here.
First, let’s look at XTN. The weekly chart shows a potential Head and Shoulders top with support from 70 to 68, the highs of 2018, and 2019 (we note that the 2020 high was lower than these). A break of this support would suggest the economy should slow more than expected and would be a concern. In addition to the price pattern, the manner of trading is vital to monitor. In 1987, the Transports broke hard to the downside before the last phase of that decline – you could feel the “air pockets”! In the absence of that sort of trading a break of support would forecast further decline, but not a dramatic break. The Dow Transports are a similar pattern, and key support there is the 12000 - area. Stochastics are the same on both of these, not surprising, as the patterns are the same. The daily and weekly stochastics are oversold and not yet in buy mode. Key areas to suggest the charts are repairing themselves short-term are 78.60 on XTN, and 14000 on the Dow Transports. We would watch both of these indexes. We show daily and weekly charts, below.
Fixed Income Review (Back to top)
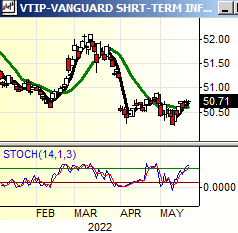
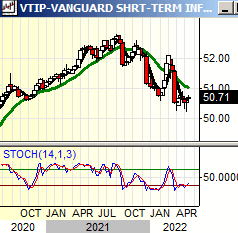
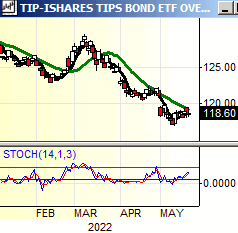
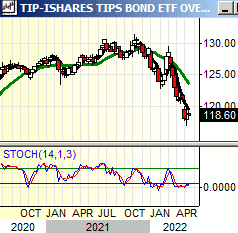
The bond market is very interesting here, as it is suggesting a short-term peak in inflation has likely occurred. Last week, we discussed some price objectives on both FVX (CBOE 5-year Treasury Yield Index) and MUB (iShares® National AMT free Municipal Bond ETF), and these have been hit. On FVX, we suggested the 30-area should continue to hold as resistance, and on MUB, we suggested needed to get above 105.50 to start a short-term bottoming process. FVX remains below 30, and MUB closed the week at 105.59. This is a potentially significant indication and improvement. Today, we will look at VTIP (Vanguard Short-Term Inflation Protected Securities ETF) and TIP (iShares® Barclays TIPS Bond Fund), as these are also significant predictors of inflation. There are two things we will mention here. The first is that both of these instruments look to have short-term peaks in place. The second is that we are interested in VTIP, as it looks to be showing significant outperformance vs. TIP. We will speak to a Vanguard wholesaler we know try to get some information on this for this. Let’s look at these units!
First VTIP: It is holding the support at 50 (actually above it), after a decline from the 52-area. The daily stochastic is short-term overbought but not in sell mode, and the weekly stochastic is in sell mode but not quite oversold. If this can hold the 50-area it could go into a trading range – then we will have to see. TIP is a worse chart. One way of looking at this is to say that if it were trading in equivalent fashion it would have held the 120-area at least, and possibly a little higher. The daily stochastic is in buy mode and about halfway up the cycle, while the weekly is oversold and has not turned up. Both of these are weaker than VTIP, as mentioned. The next support on TIP, assuming 118 fails to hold, is 115. Resistance here is 123 to 125. We would watch both of these but use VTIP in portfolios. We show charts, below.
Commodity Review (Back to top)
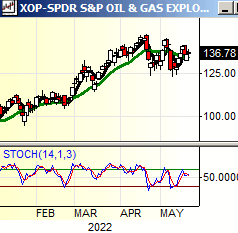
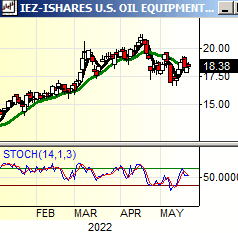
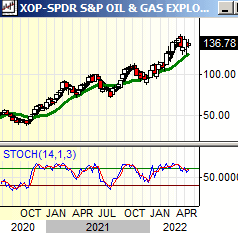
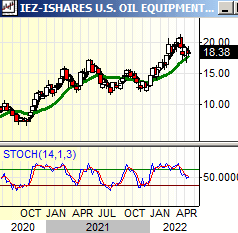
We have been asked about some of the oil sub sectors, so we will look at a couple of ETFs in that area. Let’s look at XOP (SPDR® Oil and Gas Exploration and Production ETF) and IEZ (iShares® Dow Jones Oil Equipment and Services ETF). The first thing to notice about this is that they are not following oil prices, as they are lower now than they were in 2018. Short-term they are trading well, but the intermediate term is weaker than we would have expected. Why is this? We believe it is due to current administration policies that make exploration more difficult. Several friends in the oil business in Texas have indicated to me that there is little to no incentive to drill, even though some of the onerous environmental regulations have been relaxed. The concern is that these “relaxations” are temporary. Whatever the reason, let’s look at these ETFs and see which is more attractive technically. We have chosen the two ETFs in this area that have the most volume even though they are from different fund companies. Each company has the equivalent of both of these, but these selections make the most sense.
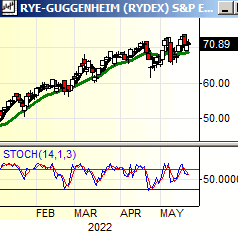
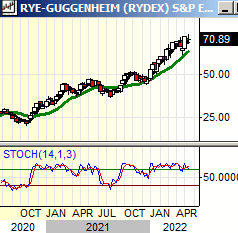
Of the two, XOP is probably the strongest chart of the two. Short-term support is the 120-area, and intermediate support is from 120 down to 113. Resistance is in the 160-area, so this does have some room to run. The daily stochastic is in buy mode, and the weekly is a sell pattern, suggesting some consolidation is likely – not a bad picture given how difficult the market has been. IEZ is weaker relative to the high in 2018. It has short-term support in the 16-area, and intermediate support is 16 to 13, with the best-looking support at 15. Resistance is in layers from 20 which has been recently been tested and held, up to 23. The daily stochastic is in buy mode but showing lack of momentum, while the weekly is firmly in sell mode. This also suggests consolidation. The one advantage of IEZ is the relatively low dollar price – which makes it suitable for smaller accounts. Other than that, we would not use IEZ. Looking at these does not change the strategy we have been recommending to invest in oil. This has been RYE (Invesco® Equal Weight Energy Index), which gives more broad-based exposure to oil than XLE (SPDR® Select Sector Energy ETF), and then adding CVX or XOM for the dividend and to add capitalization to the position. The problem with XLE, of course, is the heavy over weighting in two stocks (CVX and XOM), and our strategy with RYE is a solid way around that issue. We show charts, below.
International Review (Back to top)
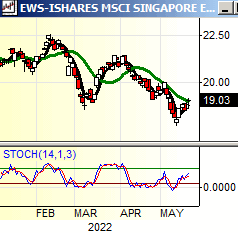
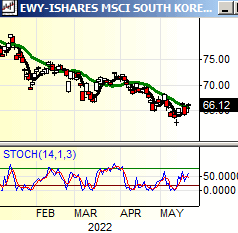
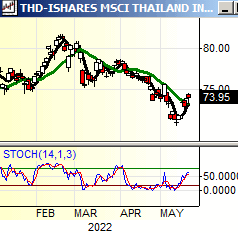
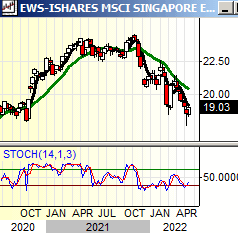
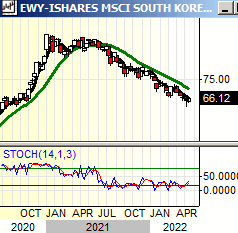
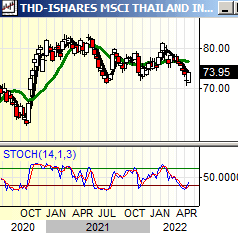
Biden’s trip to South Korea made me look at a couple of the Asian Country ETFs we don’t normally discuss. There are a couple in interesting positions. We will look at EWY (iShares® MSCI South Korea Index Fund), EWS (iShares® MSCI Singapore Index Fund), and THD (iShares® MSCI Thailand Index Fund). These three ETFs are all near support and have decent yields (in the case of EWS and THD, very strong yields). These are all interesting alternatives for portfolios. They are very different charts, and because of this it is difficult to suggest which of these is the best chart. Our favorite is probably EWS, and our least favorite is probably THD. Let’s take a look at these.
EWS has the best yield of these and is currently at the bottom of an 18 to 24 trading range. The daily stochastic is in buy mode, and the weekly is a very slight buy recycle. While there is some resistance in the 22-area this could easily test the top of the range at 24. It is a base, and with a yield of around 6.75% you are being paid to wait. The recent move to 18 filled a gap from November 2020. One additional thing we like about EWS is that it may be the only Asian country to achieve a higher per capita GDP than the United States. So, one way to look at this is that it is a growth story with a high dividend yield that has been depressed since the mid-2010’s.
EWY is a different sort of chart, as it is the only one of these that broke out above the 2020 high, although it is back below it. It has less of a yield, at around 2.5%, and has been a short-term downtrend since August 2021. This is testing support at the 65-area, the 2020 high, but has broken below the 2018 high at 80. The daily stochastic is in buy mode but showing lack of momentum, and the weekly is a new buy recycle. Short-term resistance is 70, and then goes up in layers to the 80-area. This could rally but may have less potential than EWS, and the smaller yield makes it less appealing. THD is similar to EWS, in that it made the high in 2018, but it is a bit less strong vs. the 2018, 2019 highs. In addition, the yield at 3.25% is substantially less. It is also a range, from 70 to 80. The daily stochastic is in buy mode, and the weekly is oversold and not yet in buy mode. So, EWS is very slightly stronger as well. That is the one of these we would use for now. We show charts of these, below.
Weekly Chart of Interest (Back to top)
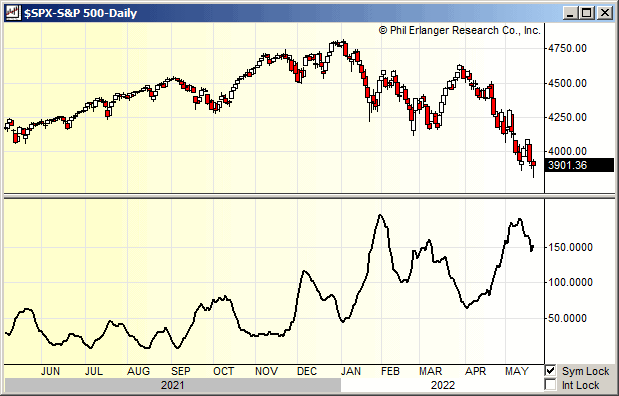
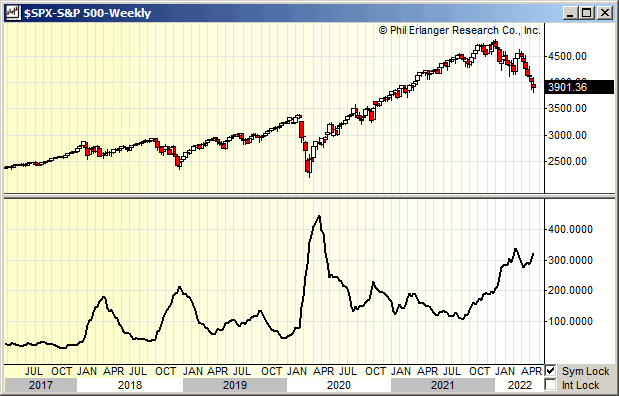
We show Fred’s Volatility Index, below, and note that it is, as we surmised on last Thursday’s call, starting to pull back from a double top. This suggests volatility is beginning to slow down, which means the market is starting to stabilize. This is short-term bullish for stocks. We show the daily and weekly charts, below.
