Search the Site
The Fred Report - Weekly May 2, 2022
The FRED Report - Financial Research, Education & Data
Volume 14, Issue 33
Trading Week Starting May 2, 2022
Download PDF Version here
Summary of Market View
Equity market indicators continue to suggest we look for a low in the June timeframe, as we have forecasted. This is actually a concern, as we have had an astonishingly good run here, and it is time for us to make a mistake. In any event, we discuss the current environment in stocks, then move into a discussion of Small Cap ETFs. In Fixed Income, we give some parameters for TLT, which looks as if it is holding in the face of the May 4th Fed Meeting. Then, we discuss the High Yield Bond ETFs.
In Commodities, we discuss the three main oil stock ETFs that we follow. In International, we discuss some of the Middle Eastern countries, and see how they are trading, as they still are the biggest oil exporters. Last, in Chart of Interest, we show Bond sentiment, which is still quite bullish, especially relative to stocks.
Stock Review (Back to top)
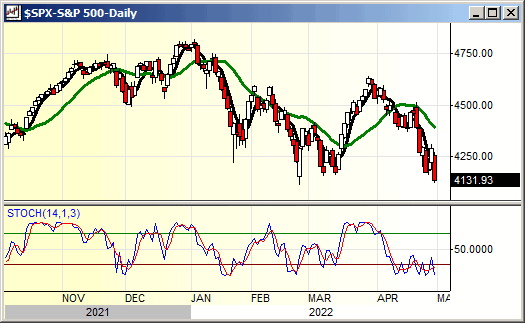
Stocks had a bad close to the month – so bad it may be good, as we are seeing some oversold readings, which we will discuss more in the Monthly out later this week. For now, we have some observations that we won’t see there. First, Accumulation models, while not good patterns, are finally diverging from each other. QQQ made big new lows, SPY not so much. This is actually a positive. We still see a low in June or so, but we now can taste it. Recall that part of our forecast for a low in June has been a weak enough economy to assure divided government in November, and last week’s GDP number may very well do it - if a recession is defined as two consecutive quarters of negative GDP, we are halfway there! If this is the case and the next quarter is also negative, it suggests that now is the time to dollar cost average some of the stronger names on your shopping list. Much of the time the market bottoms during a recession, and not at the end.
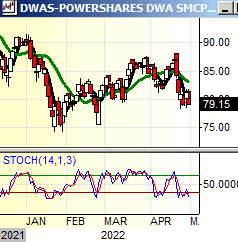
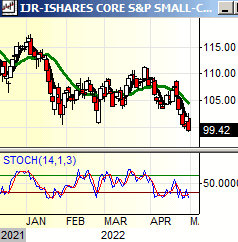
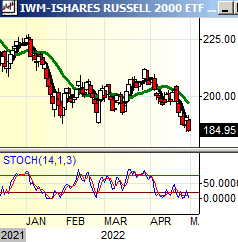
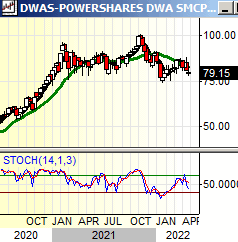
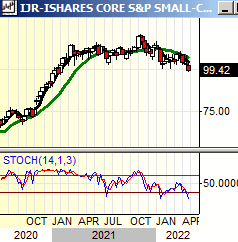
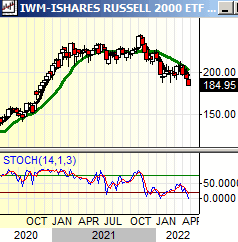
We will take a look at three small cap stock ETFs: DWAS (Invesco® Small Cap DWA Technical Leaders ETF), IJR (iShares® Small Cap 600), and IWM (iShares® Russell 2000 Index). These have all started to weaken, with DWAS being the best chart, and IWM the worst. This makes sense as DWAS buys the highest relative strength names in small cap, and IJR is the “largest” cap small cap names. IWM has IJR in it, plus1400 smaller names that in this case are trading weaker. DWAS has support from 80 to 75, and this is holding so far. Resistance is in layers from 90 to 100. The daily stochastic is oversold and the weekly is as well. IJR has support in layers from 100 to 90, and resistance is 110. IJR and IWM have the same stochastic pattern. IWM has broken the 190 support and should test 180, even if the other two hold. Below 170 would be a concern, as this would break the double top and breakout from 2018 to 2020. Resistance is 220. While these did not have the excessive rise of QQQ and to an extent, SPY, they are still trading better than the larger cap indexes an also Tech. We would consider adding to the small cap parts of models in this area. We show charts, below.
Fixed Income Review (Back to top)
TLT basically held support in the 119 to 120 area. Now, for a rally it should immediately head back above 120 and challenge 122 to 123. A move below 119 would suggest lower prices. In some respects, that would be a surprise although we note that we have been wrong on this market for a while. It will be interesting to look at how this trades after the Federal Reserve Open Market Committee (FOMC) meeting on May 4th.
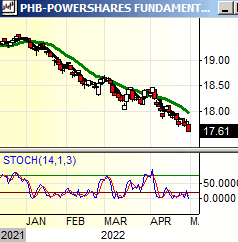
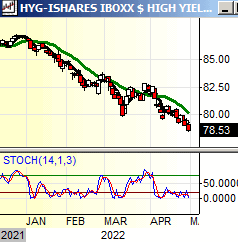
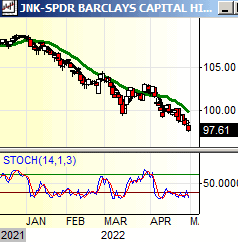
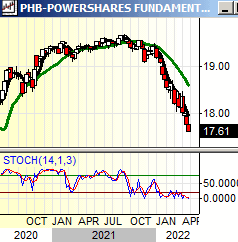
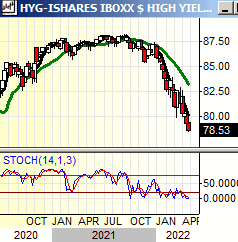
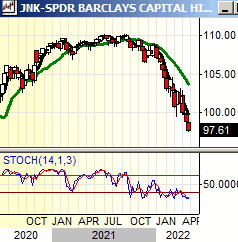
We will take a look at the High Yield Bond ETFS: HYG (iShares® Corporate High Yield Bond), JNK (SPDR Barclay’s High Yield bond ETF), and PHB (Invesco® Fundamental Corporate High Yield Bond). Of these three, HYG is the most popular, and we follow this in the Monthly Review. JNK is the weakest of the three but has the highest yield. PHB is the most interesting, as it is fundamentally weighted. In past articles, we have shown that it performs better on the upside, to compensate for a lower yield, and now we will see how it performs relative to the other two as the economy is slowing. Realize that all of these are somewhat distorted due to the pandemic and the Fed bond buying programs.
PHB is still the best chart, and it has support between 18 and 17 that is being fully tested. The daily stochastic is oversold and “in the cellar”, while the weekly is oversold, with a failed buy recycle. HYG is weaker, with support at 85 to 75 in layers, and resistance is 83 to 85. Note that it underperformed PHB and made lower highs on the rally in 2020. The daily stochastic is the same pattern as PHB, but the weekly is a worse pattern, also with a failed buy recycle. JNK and HYG are the same stochastic pattern as HYG (also weaker than PHB), but the chart is weaker as it made still lower highs on the rally. JNK has support at 95 and resistance is 100 to 105. To us, the slightly higher yield relative to HYG makes that a better choice for income. For the chance at a capital gain, we would use PHB. We think that these will bottom in the summer. We show daily and weekly charts, below.
Commodity Review (Back to top)
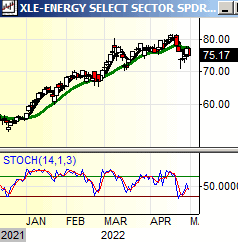
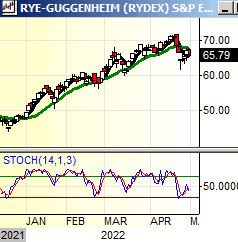
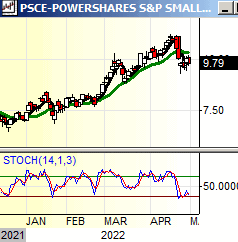
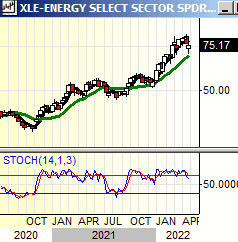
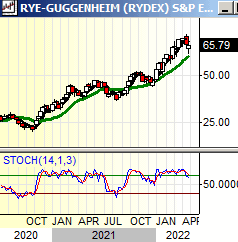
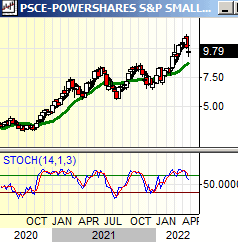
As negative seasonality gives way to the “Summer Driving Rally,” we have not looked at the three main oil stock ETFs we follow. These are: XLE (SPDR® Select Sector Energy ETF), RYE (Invesco® Equal Weight Energy Index), and PSCE (Invesco® Small Cap Energy Sector ETF). There is quite a lot of difference between these. XLE and RYE are both large cap energy, but because of the capitalization structure the holdings are very different. XLE is over 40% invested in just two holdings: CVX and XOM. In contrast, XOM and CVX are not even in the top 10 holdings on RYE. Because of this, we have recommended holding RYE and either XOM or CVX. Let’s see how these look.
XLE is the main sector ETF. It has support at 70 and intermediate support is the 60-area. It is testing resistance going back to 2015 in the 80-area. The daily stochastic is in buy mode and the weekly is overbought, but not in sell mode. RYE is substantially the same chart pattern, which suggests our strategy has not suffered. This is just a bit stronger in fact, as it is through the equivalent of the 80 resistance mentioned on XLE, but now fully testing the 60 to 70 area. Short-term support and resistance are that range, and there are layers of intermediate term support from 60 to 50. The stochastic pattern is the same. PSCE is cap weighted but a small cap name so again, the portfolio is different. Some readers will recall that we recommended this in 2020 as an “option that wouldn’t expire”. If you are still holding this it is probably time to sell, at least as a trader. There is resistance in the 10 to 11 area going back to 2016. There are layers of support from 9 to 8. PSCE is the same stochastic pattern as XLE and RYE, but it is the weakest chart overall. We think Energy stocks should have a great summer, but if we are wrong, the weakness should show up in PSCE first. We show daily and weekly charts, below.
International Review (Back to top)
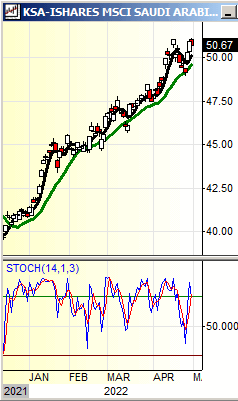
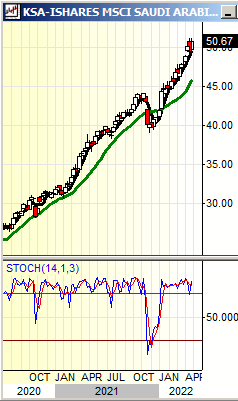
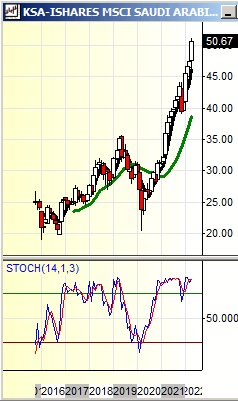
How is some of the oil producing countries’ ETFs in the Middle Eastern performing as oil prices increase? We will look at KSA (iShares® Saudi Arabia Index), UAE (iShares® MSCI UAE Capped ETF), and QAT (iShares® MSCI Qatar CP ETF). These are similar intermediate charts and have followed the price of oil up. Of these three ETFs, KSA does the sort of volume that makes it tradable, while QAT and UAE both do around 14,000/day. So, we will just show KSA, below. Note that KSA is also the strongest technical picture as well has having tradable volume. We discuss the other ETFs briefly below but there is no need to show the charts.
KSA is a solid uptrend with short-term support around 48, and intermediate support in layers from 45 to 40. The daily stochastic on KSA is in slight sell mode, not a concern because the chart is strong, and the weekly is stuck “on the ceiling”. UAE is a touch less strong as the daily chart has just buy recycled, and the weekly is overbought but could soon enter sell mode. QAT is the weakest of these, as the daily is oversold and has not turned up, while the weekly is in sell mode. The stochastics and the chart patterns, as well as the volume, all suggest KSA is best of class. However, we would not really use any of these, but rather use one of the oil stock ETFs in the Commodities section, above.
Weekly Chart of Interest (Back to top)
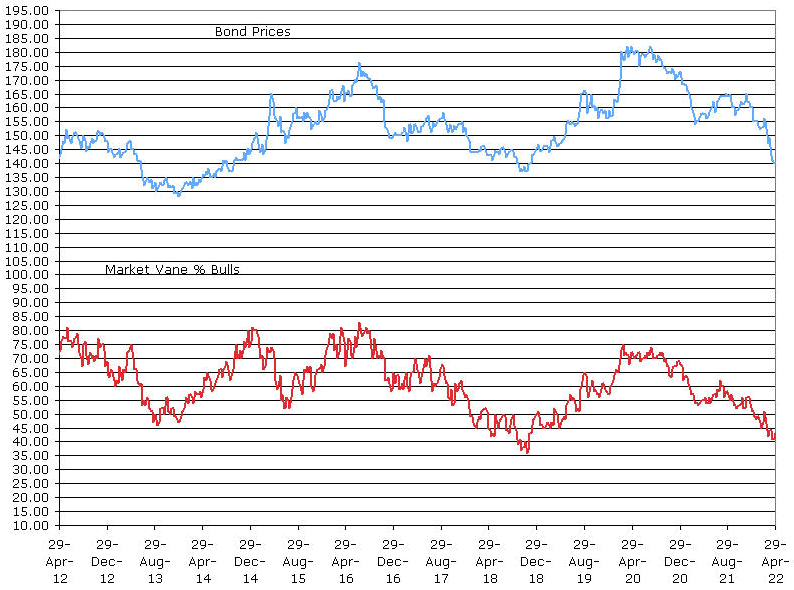
We show the chart of Bond Sentiment. We are surprised that it is not worse than this at this juncture. To put this in perspective, the Bulls actually ticked up from 40 to 43 last week. In contrast readings in the low 30’s to high 20’s occurred in 1999 and 2003. Sentiment is NOT giving a buy signal on bonds at this time.
Member Log In

Who is Fred Meissner, CMT?
Listen here:
The FRED Report is not authorized, endorsed, or affiliated with the Federal Reserve of St Louis and its FRED Economic Data.


