Search the Site
The Fred Report - Weekly May 23, 2011
The FRED Report - Financial Research, Education & Data
Volume 3, Issue 41
Trading Week Starting May 23, 2011
Download PDF Version here
Summary of Market View
The stock market has been down the last three weeks and should also decline this week, favorable holiday seasonality notwithstanding. We would use weakness to slowly accumulate stocks in strong sectors.
Bonds have rallied as expected and while we see the potential for more up-move into June, stops should be raised in case these moves end early. Overall, we expect higher rates, and lower prices into the end of the year.
Commodities should continue a rebound rally, but this should give way into lower closing lows sometime in the next few months. We look at gold and silver stocks – they may do better in the second half of the year.
Stock Review
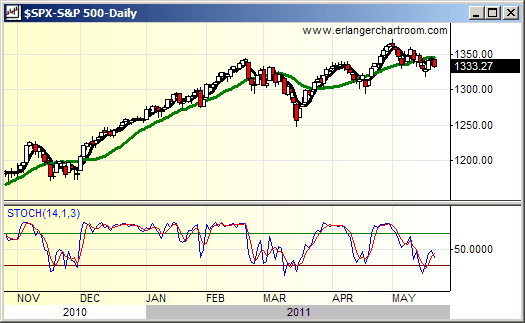
For new subscribers, and also as a recap – our forecast has been for a declining market into the end of May, followed by a strong second half of the year. One of the reasons for this forecast is overbought readings on our Monthly indicators, and in order to correct these, the SPX needs to decline into the end of the month of May. We note that the last three weeks have been down on the SPX, and ideally this week will be down as well, followed by a low close on May 31. Then markets, followed by some choppiness, can start of a rally by the end of June. Several subscribers have asked about Investor’s Intelligence bears being below 20 for such an extended period of time (7 weeks), and it IS unusual. But, take a look at the research piece we did on sentiment in December of 2009 (in the Special Research Articles section). These streaks are, most often, bullish three months out, which is in line with our forecast.
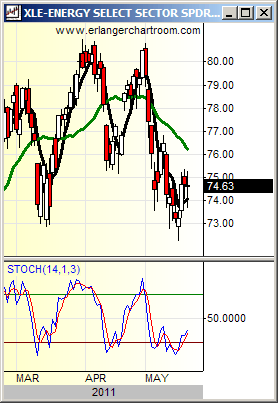
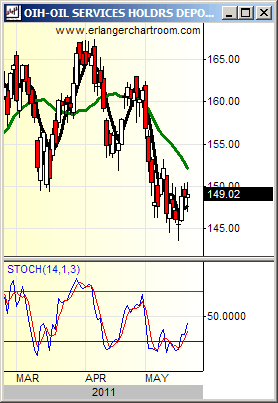
We have been looking at Sectors with an eye towards possible adjustments should the market decline. We note that our two overweight sectors, XLP (SPDR Select Sector Consumer Staples ETF), and XLY (SPDR Select Sector Consumer Discretionary ETF) have been market leaders. In our letter of May 9, we advised slowly adding back some money we had raised, for investors willing to take risk, and we would continue that process if the market falls this week. We note that accumulation models in Materials and Industrials, two of our equal weights have weakened sharply in the last week, but that Energy has actually improved such that subscribers should be adding money to this sector first – it is our favorite equal weight. We show charts of XLE (SPDR Select Sector Energy Sector ETF) and OIH (HOLDERS Oil Service ETF) below. We would emphasize the XLE over the OIH, as this ETF contains the kind of “household name” oil stocks foreign investors tend to buy first.
Fixed Income Review
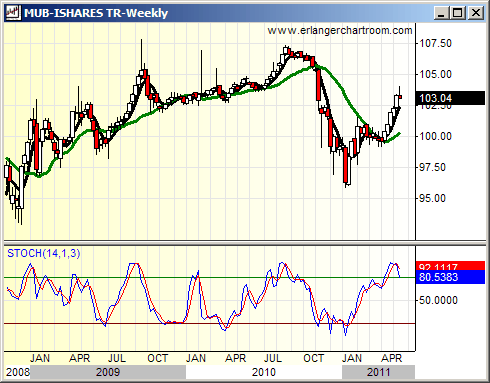
Bonds had a flat, rather than down week, as we had expected. While the accumulation models on the bond ETF’s remain positive, price oscillators are now overbought, and in some cases (see chart below of weekly MUB [iShares National Municipal Bond ETF below]), they have traded up to resistance. In addition, Market Vane sentiment has increased to 62% bulls. We become concerned when this number gets above 70% bulls. Our forecast has been for a rally in bonds to run into June, followed by a slow, choppy decline into the end of the year.
What the above suggests is that bond traders should start to be a bit more defensive, as this trade has likely run most of its course. We give a few numbers: TLT (Barclays 20 Year Treasury Bond iShare) has been forecast to test the 98 area, and this is still likely, but a move below 93.10 would negate this. LQD (Investment Grade Corporate Bond iShare) could test 114, but a move below 109.40 could negate this. Last, the MUB may move above 105, but 104 is significant resistance, and a move below 101.80 would negate this. We are much more cautious on bonds – plan for the worse, hope for the best.
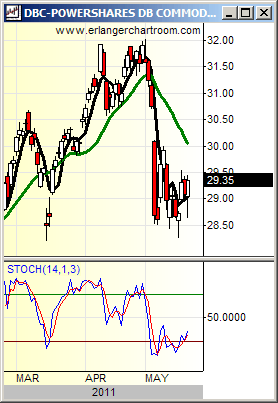
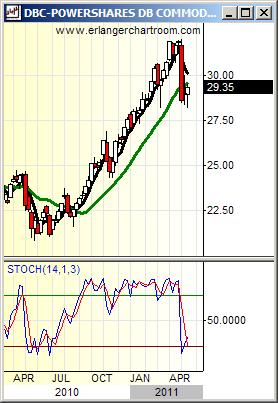
We show daily and weekly charts of DBC (Powershares DB Commodity Tracking ETF) below. Subscribers can see that daily stochastics are positive, while weekly stochastics have a bit more to go on the downside before giving a classic buy signal. This suggests that a rally is imminent in the commodities, but that it should occur within the context of a longer, more complex bottom. This, indeed, has been our forecast: these markets should chop around and perhaps make a lower closing low a month or so from now.
We remain an equal weight in gold, but not silver. If we are going to be correct about a strong commodity rally in the second half of the year, gold should outperform (as it is doing now). The real question is where rebound rallies can go, and for this we shall have to be patient.
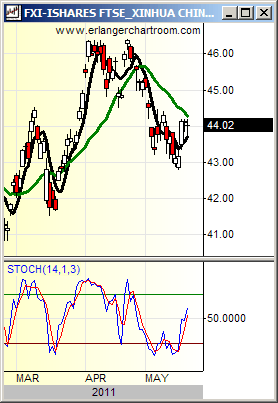
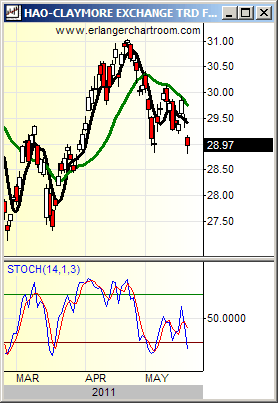
We show two charts of the Chinese market – FXI (iShares FTSE Xinhua China 25 Index ETF) and HAO (Guggenheim China Small Cap ETF). We note that the HAO has been leading the FXI until recently, an indication that the Chinese domestic economy remained stronger than their big cap, export oriented stocks. In recent weeks that out-performance has narrowed, suggesting that China really is slowing.
While we continue to prefer (as we have for some time) EWS (iShares MSCI Singapore Index Fund), EWM (iShares MSCI Malaysia Index Fund), and EWY (iShares MSCI South Korean Index Fund) to China, one of the reasons for this is that these markets are, essentially, gateways to China trade and as such they may also slow for a while.
We also note that the dollar index continues to attempt to rally, and should DXY make it through 76.60 and then 77, a move into the low 80’s is possible. A strong indication that this is going to occur is the FXE (Rydex Currency Shares Euro Trust) below the 140 area. We will write more about this in the midweek should it occur.
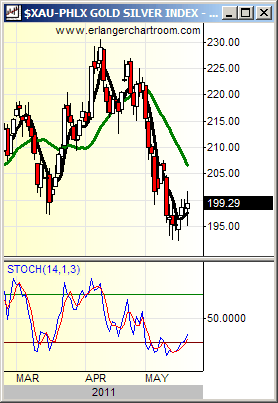
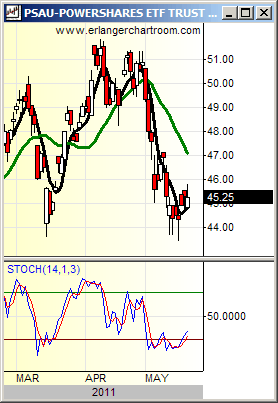
We show charts of XAU (Philadelphia gold/silver index) and PSAU (Powershares S&P Small Cap Gold and Silver Stock ETF), an Index and ETF respectively, consisting of metals’ stocks. These stocks have not performed in line with the gold and silver markets so far this year, but this may change as many reports suggest the reason for this is hedging on the part of these companies and the big hedging months are June for gold and July for silver. Note that Stochastics have moved below, and then above 20 in recent days, a classic buy signal.
Member Log In

Who is Fred Meissner, CMT?
Listen here:
The FRED Report is not authorized, endorsed, or affiliated with the Federal Reserve of St Louis and its FRED Economic Data.


