Search the Site
The Fred Report - Weekly February 26, 2018
The FRED Report - Financial Research, Education & Data
Volume 10, Issue 14
Trading Week Starting February 26, 2018
Download PDF Version here
Summary of Market View
In Stocks, we note that the indexes have traded into our target range, and now we have to see if there is some more choppiness and corrective behavior. We then turn to a discussion of the Healthcare sector and two subgroups – Biotech and Pharmaceuticals. In Fixed Income we show our interest rate indexes again and note that these are mostly at resistance.
In Commodities, we look at Oil Stock ETFs. Several clients have asked about this area of the market over the last week. There are several interesting selections here. In Chart of Interest we continue the discussion on oil with a couple of aggressive equity ideas. In International, we take a look at some of the “outlier” foreign ETFs. We look at two country and two sector ETFs.
Stock Review (Back to top)
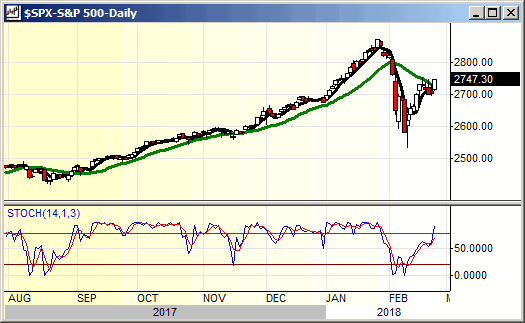
The stock market is trading about in line with expectations, and we are in the 274 – 280 target area on SPY. We think there is a good chance the market trades up and down this week, and then heads for a retest in March. However, with the exception of sentiment indicators, there is enough improvement in other indicators to suggest the next few months should be strong for the market. In other words – we do not have any real changes in opinion. Since we have been asked about the healthcare sector we will have a look at that this week.
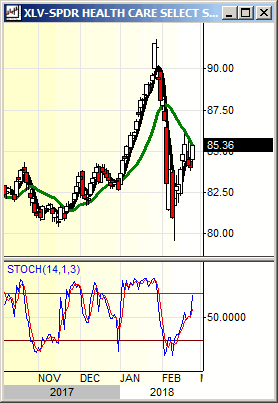
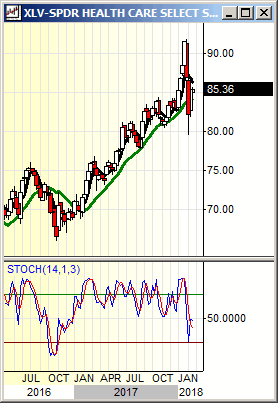
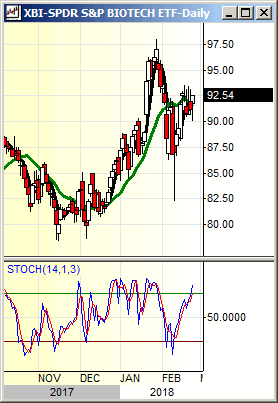
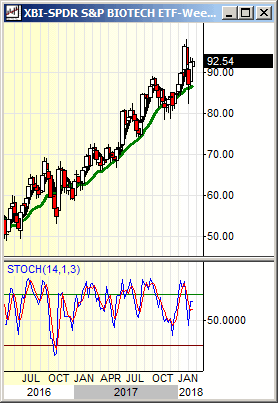
XLV (SPDR® Select Sector Healthcare ETF) has held intermediate support in the 81- area and short-term support is 84 or so. Short-term resistance in the 85 to 87 - area has also held XLV the last few days. Weekly stochastics have almost recycled, but another week or so would be helpful and lead to a complete recycle. We like XLV and give it a strong equal weight. The most interesting subgroup in healthcare is Biotech and there are a couple of ETFs we use. These are IBB (iShares® NASDAQ Biotech fund ETF), XBI (SPDR® S&P Biotech ETF), and PBE (Powershares® Dynamic Biotech ETF). These three are interesting, mostly because PBE is the most attractive short-term chart, while XBI is the most attractive long-term unit. An attractive buy point on XBI is 91.30, and on PBE we would try for 51.20 but be prepared to buy on a breakout above 53.45 if that is not hit.
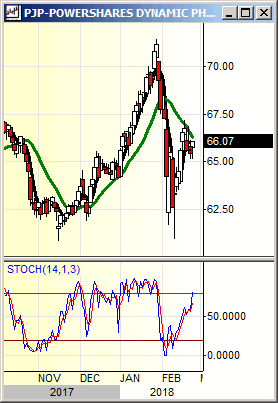
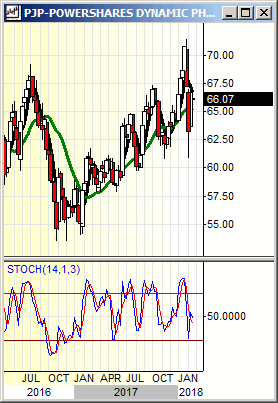
The other area in XLV that is interesting is Pharmaceuticals – the ETFs we follow there are IHE (iShares® Dow Jones Pharmaceutical Index Fund), PJP (Powershares® Dynamic Pharmaceutical ETF), and XPH (iShares® Pharmaceutical ETF). We thought these were going to pick up in the fourth quarter of 2017, but this failed to occur. The chart patterns on these suggest they should rally in 2018, however. Our favorite of these is PJP, which has support in the 65 to 64 area and resistance in the 67-area. Similar to Biotech, the weekly stochastics are down but not completely recycled. Another couple of weeks of choppy market behavior would really help. We show charts of XLV, plus our two favorite subgroup charts – XBI and PJP.
Fixed Income Review (Back to top)
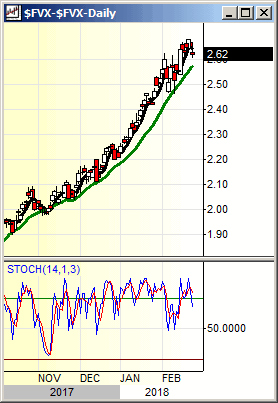
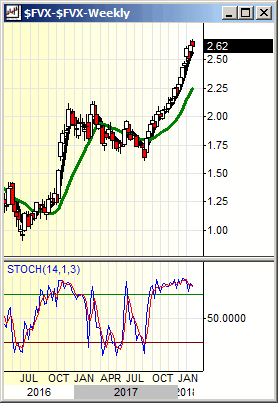
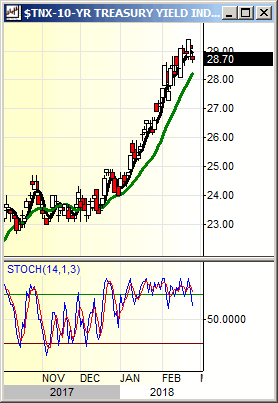
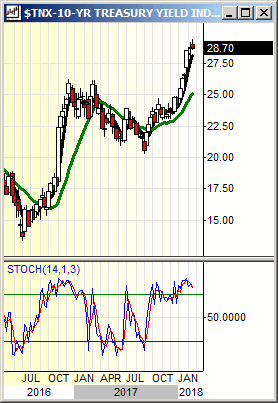
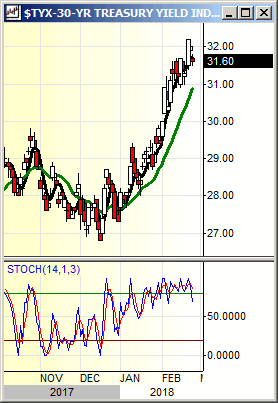
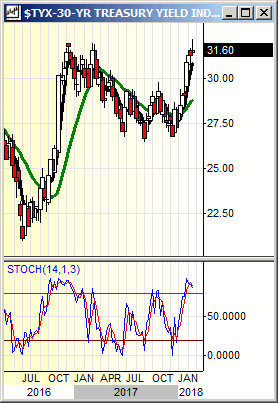
We will look at the interest rate indexes this week, because the trading in these was interesting last week. These are: IRX (CBOE Short-term Yield Index), FVX (CBOE 5-year Treasury Yield Index), TNX (CBOE 10-year Treasury Yield Index), and TYX (CBOE 30-year Treasury Yield Index). We will show charts of the last three (IRX is straight up, which should be obvious). When you look at these charts, realize that the shorter rates are dragging the longer rates up, so in our view it is only a matter of time before TYX breaks above 33. Our base case is still that rates should move back to where they were before QE began. This would put the 10-year around 4, and the 30-year around 5. TLT, our favorite bond ETF would test the 96-105-area. There was an interesting piece by Goldman Sachs that suggested a ten-year bond yield of 4.5% would cause a 25% drop in U.S. stocks. We do not agree – as long as a rise in rates is accompanied by growth there should not be any problems.
Long-time readers should remember that our benchmark for declaring the secular bull market in bonds is over is TYX trading above 33 (the real number is 32.50, and TYX got to 32.21 last week, before backing off). Then the prospect for rates to move to those levels is quite high. It is interesting that FVX is trading nearer 2009 levels – 32-36. This may be the key chart to watch as it has started to weaken ahead of the longer dated units. The indicators on FVX suggest this is due for a period of consolidation so the rise in rates may abate for a while.
The instrument most of us watch on a constant basis is TLT, which is a 20-year bond ETF. This will trade inversely to the indexes mentioned above, but there are some key areas on TLT to watch. Perhaps most important is the 117 area. It broke last week but has revalidated. Because it is a trading instrument with volume we can run our accumulation model on it and that looks better than the indexes and TLT itself. This suggests TLT may bounce around here for a bit rather than just plunge – although as mentioned we believe this could hit 105 this year.
Commodity Review (Back to top)
We have had a large amount of questions on oil, oil stocks, and oil related ETFs. We will discuss oil itself and look at some of the oil ETFs here and discuss some oil stocks in the Chart of Interest section. First, when we look at oil so far it has followed the seasonal tendencies pretty closely. We have indicated to clients that it has actually been weaker than we expected, and this is why we advocated selling oil in January. Oil came down, but much faster than we expected. We have price targets on WTI of 67 to 72 but expect at least the upper end of these to be hit at the end of 2018 and not in the summer. Currently oil is between 63 and 64 on our perpetual contract, suggesting further advance but timing this may be difficult. We would not be surprised to see oil, and oil stocks, sort of bump along and consolidate into May.
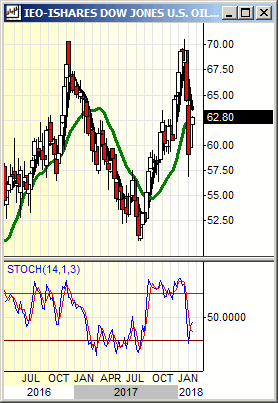
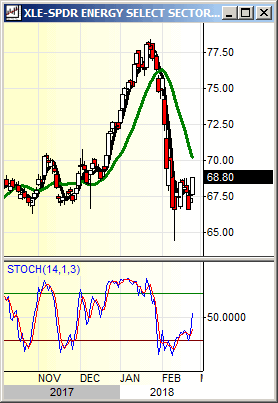
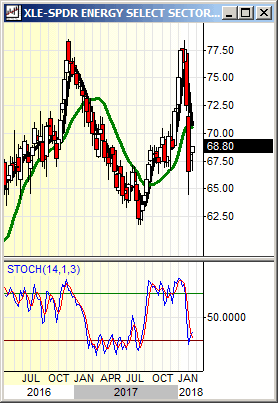
We follow a number of oil stock ETFs. They are: XLE (SPDR® Select Sector Energy ETF), PSCE (Powershares® Small Cap Energy Sector ETF), XES (SPDR Oil and Gas Equipment ETF), XOP (SPDR Oil and Gas Exploration and Production ETF), CRAK (Market Vectors Oil Refiners ETF), PXE (Powershares® Dynamic Energy Exploration and Production), PXI (Powershares® Dynamic Energy Sector), OIH (HOLDERS Oil Service ETF), IEZ (iShares® Dow Jones Oil Equipment and Services ETF), and IEO (iShares® Dow Jones Oil and Gas Exploration and Production ETF). This is a larger number of ETFs than we talk about, and we will not chart all of these in this article. There are some differences in the chart patterns and we will discuss these.
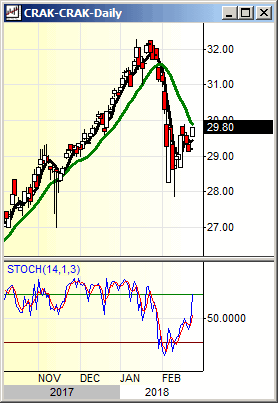
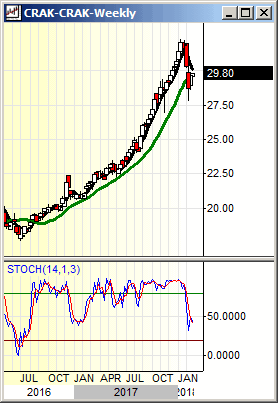
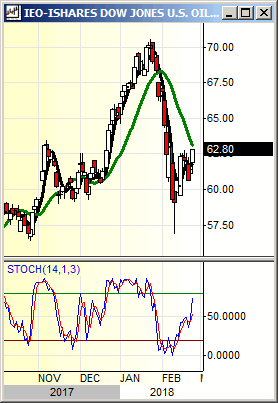
The above ETFs encompass most of the sectors and areas within the oil market. The most attractive on a relative basis is CRAK – the refiners. We would use this in portfolio models right away as it has the strongest relative strength. Oil investors probably will want to use an “exploration” or “services” ETF as well. These are the weakest ETFs of this bunch. The strongest of this group is IEO, and the second strongest is PXE. OIH is the worst of these and we would not use it. XOP is lagging as well. Of the standard energy sector ETFs, XLE is stronger than PSCE but for advisors oriented towards performance rather than beta we would not use these. Of course, we use these in our sector portfolios and they are lower risk relative to their indexes. They do provide balance to portfolios. If I were putting together an aggressive oil portfolio today I would use CRAK, IEO, and XLE. We show charts of these, below.
International Review (Back to top)
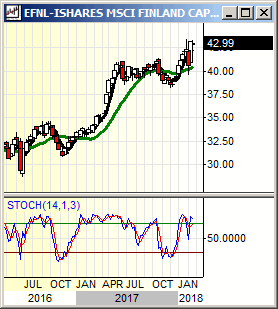
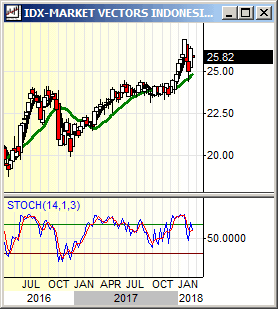
Since none of our international opinions have really changed, we decided to take a look at some of the International ETFs that we do not ordinarily cover. There are some interesting ideas for aggressive advisors, or to use to add some “spice” to portfolios. The first one is EFNL (iShares® MSCI Finland Capped Index Fund), a strong performer that is close to making new highs in this environment. This is thin and volatile but trading well as long as the support in the 40 to 39 areas can hold. Nokia (NOK) is around 16% weighting in EFNL and NOK is starting to improve. We in the U.S. know them mostly for cell phones but they have other IT strengths, including Bell Labs (Nokia bought Alcatel-Lucent). IDX (Market Vectors Indonesia Index ETF) is another interesting idea, as it is coming out of a long base and the recent correction tested the breakout and has held so far. As long as 24 holds, this is a strong chart and could be a good diversifier. These are two interesting country ETFs
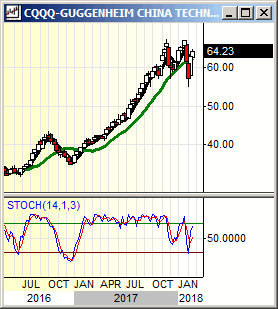
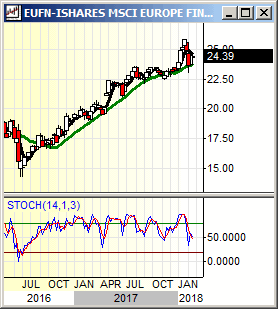
We’ll also look at a couple of interesting International Sector ETFs as well. Two are CQQQ (Guggenheim China Technology ETF) and EUFN (iShares MSCI European Financials ETF). CQQQ is performing better than some of the Chinese Index ETFs, FXI in particular. FXI is not the best choice, as we have mentioned in other venues, but for those who do not want to sell it adding CQQQ is an idea that should augment their performance. As long as CQQQ can stay above 56 it is strong intermediate-term. EUFN is a European recovery play. It is trading a bit stronger than EWG (iShares® MSCI German Index Fund) and would be a good addition to portfolios as a diversifier. We show weekly charts of these four ETFs, below.
Weekly Chart of Interest (Back to top)
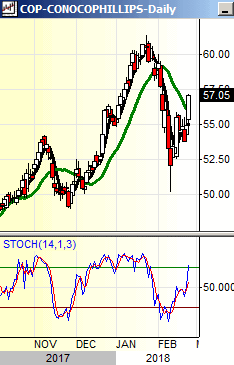
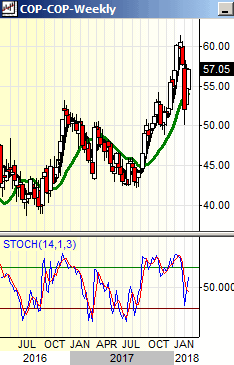
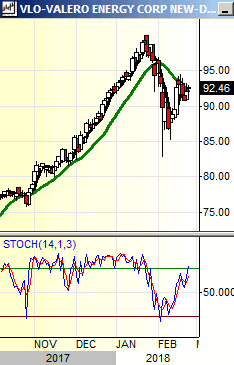
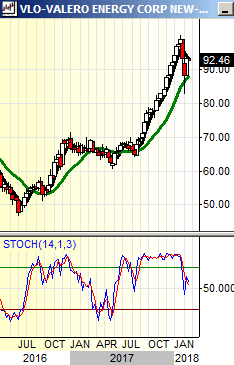
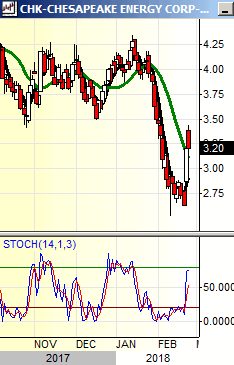
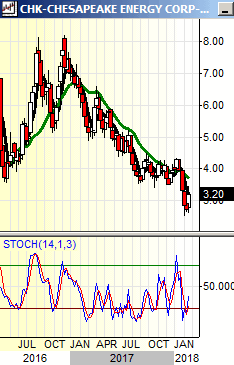
In line with questions on the Oil Stock ETFs, we have had some questions on oil stocks. Our most conservative choices are featured in the Sector Review: CVX, HAL, and PSX. Some advisors have asked for some more active and aggressive stocks, so we will give these and charts, below. Ideas would be CHK, VLO, and COP. In particular, COP is a strong and conservative chart. CHK is attempting to advance; it looks like there is a decent shot above 3.50, for a shot at 4.50 or so. We show daily and weekly charts, below.
Member Log In

Who is Fred Meissner, CMT?
Listen here:
The FRED Report is not authorized, endorsed, or affiliated with the Federal Reserve of St Louis and its FRED Economic Data.


