Research Piece: Using % Bears Condition Indicator
Using % Bears Condition Indicator - by Fred Meissner, CMT
This month’s research piece looks at our Investors Intelligence % Bears indicator. As long time subscribers know, we break the market down into three basic market principles: (1) Internal Momentum, (2) External Momentum, and (3) Sentiment. Of these three principles, Sentiment Indicators have always been condition indicators for us, and not timing tools. Several clients have asked what this means, so we elucidate here.
Condition indicators deal with the backdrop to the market, or the overall macro environment. This is important because sentiment is a reflection of the environment as well as being a component of market activity. Often sentiment is negative when things are bad and getting worse. An example of this would be the sentiment readings during the 1973 – 1974 timeframe. Sentiment became very bearish as Watergate unfolded; hitting the highest number we have ever seen at 69.6% bears in early August as President Nixon was resigning from office. Our % Bears model, some moving averages of % Bears on Investors Intelligence, hit 66% bears in September of 1974. The reason we mention these numbers is that normally when the model moves above 26% bears and into the 30% bear’s area, an extreme in sentiment has been reached. However, in the aforementioned time frame, things WERE bad and getting worse – the sentiment numbers simply reflected the environment. Equally important, though, is that when the macro backdrop improved, and the markets turned, there was plenty of fuel for a substantial advance. Indeed, that 1974 time period was, in retrospect, the very best buying opportunity in many decades.
When we hear about the market being a “Discounting Mechanism”, one of the best ways to measure that discounting is through analysis of sentiment. That is why we only use % Bears even though the Investor’s Intelligence numbers are reported as Bulls, Bears, and Correction. Bears act right away, while bulls are generally invested, and many hold through corrections. Since bears are generally in cash or cash equivalents, this cash is “gas in the tank”, and provides “fuel” for an advance.
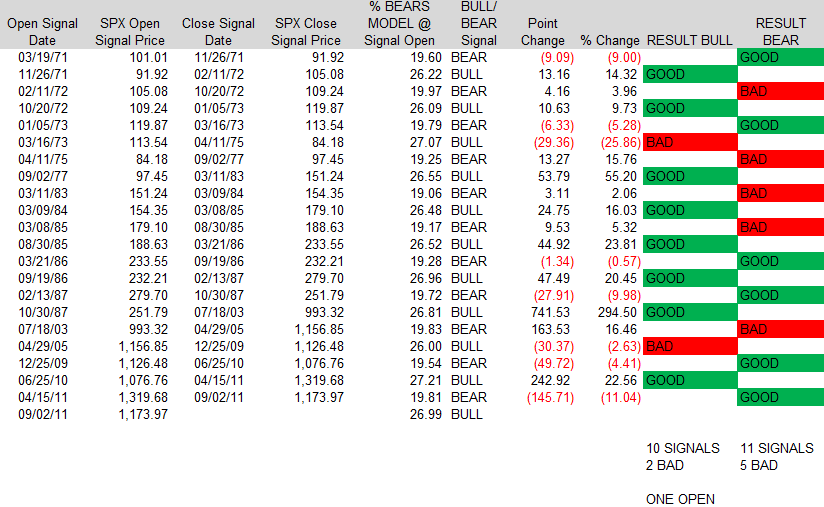
In our study, we used the parameters of 26% bears to give a buy signal and 20% bears to give a sell signal. In other words, if the model (which is moving averages of % Bears) hit those numbers, an opposite signal was given, and we assumed you stayed either long, or short the stock indexes until the opposite signal was given. Results are given in the table shown below. This study shows, once again, why we do not like methodologies with rules that are written in stone. There were several “almost" signals given, the best one of which was the bear signal given on July 27, 2007 at SPX 1458.95, fairly close to the absolute high of 2007. We also note that perceptions changed in the in the 1990’s as no signals were given for the entire decade.

We wanted this study to be useful for longer-term investors and it is. There are 21 closed signals (the open signal is a “buy” given on September 2 with the SPX at 1173.97). Of those, there are 9 buy signals, only 2 of which were bad for a 78% success rate. There are 11 sell signals, and 5 of these were bad, for a 55% success rate. Since bottoms are usually formed more quickly, and on higher emotions (e.g. panic) as opposed to complacency these results are acceptable. Perhaps more important is that this method missed the crash of 1987 and became bullish at the end of October 1987, a good result. The method basically stayed positive through the decade of the 1990’s, also by and large a good result, although it was interesting that the lowest the model got at the peak in 1999 - 2000 was 26.91 in August of 1999. Also, as mentioned, the closest “near miss” was a sell signal in July of 2007 (20.1%). What is interesting is that the week of July 20, 2007 was also the high on the SPX and Transports.
In conclusion, this indicator works about as we expected before doing the study. Buy signals work better because of higher emotion in the market place (and this is as it should be). There is not a huge amount of signals, or a lot of false signals. Also of interest is that these parameters work pretty well “in a vacuum”. But, a look at the S&P 500 shows several meaningful moves, up and down, between October 1987 and July 2003 for example! This is what we mean by and how we use, condition indicators – we combine them with timing tools, such as our 5 and 20 moving averages, to initiate positions, and also use them to check our premises. A good example of this is our reaction to the latest buy signal: September 2, 2011. Our reaction to divergences here on what could be significant market lows is different than if the % Bears Sentiment Indicator had been at 20 or below. In that instance we would tend to expect further decline. Our interpretation of the indicator right now is that, should timing stuff start to go positive, the market could have a larger up-move than many expect – due at least in part to the “extra fuel” that bearish sentiment has put in the tank.