Search the Site
Research Piece: Investor's Intelligence Bears - Follow Up
Research Piece: May 2010 - by Fred Meissner, CMT
We continue to have questions about sentiment indicators, especially the low levels of bearish sentiment on Investor’s Intelligence that we have seen this year. In our Monthly Report of December 2009 we showed that a string of readings below 20% bears is not a negative under certain circumstances, and we encourage readers to have a look at that article. However, the fact that the economy is emerging from recession may not be the only reason for such strings of numbers. We will take another look at the data and “see what we can see”.
As background, recall that we consider sentiment indicators in general, and Investor’s Intelligence numbers in particular, to be “condition” indicators and not “trading” indicators. By this we mean that they describe the overall market environment without suggesting immediate action in the absence of a trading set up. Also – we look at the %bears only. The reason for this is that bulls are complacent, and already invested, and may have no real impetus to act. People may decide to hold through a correction. However, it is a rare bear indeed who says, “I am bearish, I am long, and I do not care.”
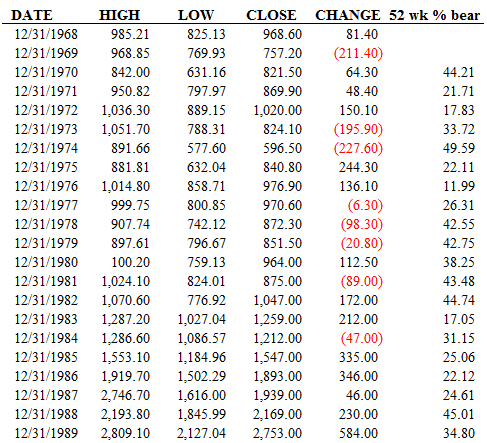
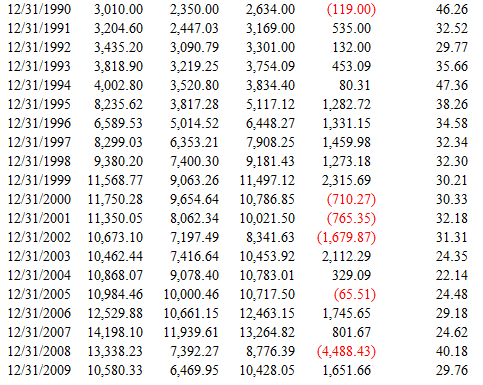
We decided to take a very long – term view of sentiment and found some interesting things. The methodology we employed was to make an approximate 52 week moving average of the %bears, starting on the first trading week of a year, and finishing on the last trading week of the year. Note that some years had 51 trading weeks, others had 52 or even 53. Sentiment is, of course, psychological – and we believe that people’s psychology is different at the start of a year, and the end of a year, than it can be during the year. Frankly, a straight 52 week average produces similar results – but we wanted a number that would be useable at the start of a year, without prejudice. We show the data below.
A couple of things are clear. First is, like many indicators, sentiment has changed parameters over the years. In the 1970’s, there were many readings below 20% bears, while in the 1980’s there were very few. While nobody knows the reason for this we suspect that the revolution in communication, both in speed and available news, has much to do with this. The last year we saw a definitive 52 week average reading below 30 was 1983. So, this indicator may not be giving strong sell signals any more. However, there is one noticeable buy signal – and that is when the 52 week moving average is 40 or above at the end of the year. Since 1970 there has only been one failure of this, and that was in 1978. 1979 was not a severe down year, and the 42 reading in 1979 led to a strong advance. The last occurrence of this was in 2008, and 2009, and so far 2010, have been up years. Note, for those who are curious – so far the 2010 average is 20.87, but according to our methodology the figure is meaningless until the end of the year. Still, the numbers have been interesting of late – we see many parallels in the trading now vs. in the latter ½ of the 1970’s (the small and mid cap out performance being another significant example). It may be that these numbers will again morph back into the pattern they had in the 1970’s.
The last thing I will mention is that this study, and careful examination of the raw data, suggest that sentiment provides a useful backdrop to market activity but does not produce useful trading signals. We will rely on the FRED report market principles that govern trading – internal and external momentum.


Disclaimer:
Member Log In

Who is Fred Meissner, CMT?
Listen here:
The FRED Report is not authorized, endorsed, or affiliated with the Federal Reserve of St Louis and its FRED Economic Data.


