Search the Site
Research Piece: Using Relative Price Trend – by Bob Robbins
Research Piece: April 2010 - by Bob Robbins
Using Relative Price Trend: The Basic Strategy of a Top-2% Ranked Money Manager
By
Robert S. Robbins, CEO
Robbins Capital Management
Bob@RobbinsCapitalManagement.com
www.RobbinsCapitalManagement.com
Relative Price Trend, or the price of a stock divided by the price of the S&P 500, is one of my basic technical strategies. It has helped my net returns of my firm exceed the S&P 500 10 percentage points average annually over the past 5 years – without using any leverage (i.e., margin) and with large-cap orientation and diversification. As Chief Investment Strategist of Robinson Humphrey, this same strategy helped my all-cap RH portfolio rise 28% compounded annually net of a 3% wrap fee over 15 years (a 40-fold gain).
Essentially, relative price trend is technical momentum, because the trends I select are among the strongest (i.e., highest rate of price gain over time). I’ve discovered that the most important timeframe for maximizing time-weighted returns is three months. Hence, I search for stocks with the highest relative price gain today vs. 3 months ago. That’s reasonable because companies report financials every three months. Longer-term relative price trend is also helpful, but less so. This strategy requires trading frequently to adjust to the strongest trends, although the net result for me is almost all long-term holding periods for tax purposes.
By using relative price trend, I effectively “ride the coattails” of the smartest fundamental investors in a particularly strong and early price trend. Trends tend to persist quarters or sometimes even years, because the driving economics, whether micro (industry-specific) or macro (national and international), tend to be sustainable. When the relative price trend of a stock weakens significantly, I sell the stock – once again riding the coattails of the smartest sellers or short sellers.
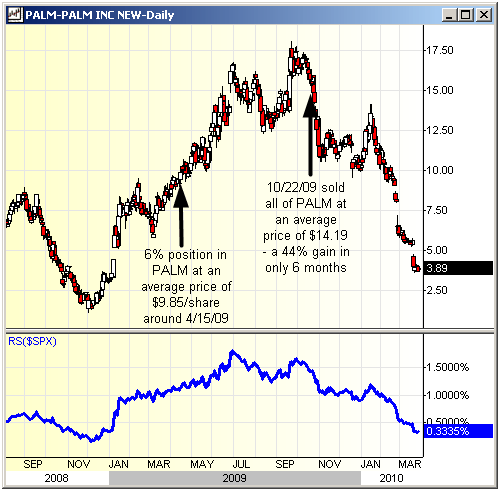
PALM is perhaps my most dramatic recent illustration of this strategy within my last 5-years’ performance. See the attached chart of PALM: I bought about a 6% position in PALM at an average price of $9.85/share around 4/15/09, when PALM was posting not only a 3-month price and relative-price high but also a 1-year price and relative price high. When PALM’s 3-month relative price flattened and turned down around 10/22/09, I progressively sold all of it at an average price of $14.19 – a 44% gain in only 6 months. Today (3/22/10) PALM is still downtrending at $4.01, less than half my buy price and less than one-third my sell price. Incidentally, when I sold PALM, I had no specific fundamental insight into PALM’s problems. I “rode the coattails” of selling investors, who sensed trouble coming.
I recommend one add-on rule: during greater than 5% stock market declines, increasingly use price change, instead of relative price change, in order to raise cash and try to preserve capital. For me, that has resulted in raising 25% to 95% cash an average of twice annually.
PALM illustrates another of my technical observations: trends tend to be far stronger and last far longer than most people expect – both positively and negatively. In sum, big trends are big opportunities for investors using this technical indicator.

Disclosures for Robbins Capital Management: Past performance is not necessarily indicative of future results. PALM is only one of perhaps 75 stocks that I buy annually in a portfolio averaging about 30 stocks. Hence, PALM is not representative of my average stock performance. Finally, I hired Mr. Meissner, the publisher of this newsletter, and worked with him at Robinson Humphrey for 10 years starting August 1989.
Disclaimer:
Member Log In

Who is Fred Meissner, CMT?
Listen here:
The FRED Report is not authorized, endorsed, or affiliated with the Federal Reserve of St Louis and its FRED Economic Data.


