Search the Site
Research Piece: Secular Bear May Be Bull
When Technical Market Analysts get together, the talk often turns to the markets! In these discussions, one question that provokes vituperative discussion is whether the United States and other markets around the world entered a secular bear market in 2000. We have some observations about this, but before we look at some charts, let’s define our terms.
First – the term SECULAR is defined as a cycle that is generational in length, i.e. 15 - 20 years or so. Second – the term BULL MARKET is defined as a market that is rising in price, and a BEAR MARKET is defined as a market that is declining in price. We define bull and bear market simply for the sake of completeness, but many people bandy about the term “secular” without having a clear definition of the word.
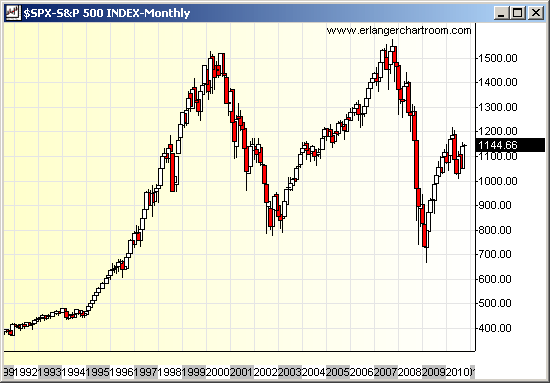
Much of the justification for suggesting that the secular trend changed in 2000 comes from analysis of the S&P 500. This is for two reasons. The first is the magnitude of the decline from 2000 to 2002. For the record, the SPX declined from a high of 1552.87 in March of 2000 to a low of 768.63 in October of 2002, a decline of just over 50% in two years. Since declines of 50% or greater do not happen in bull markets, this would suggest a change from secular bull to secular bear. Another, perhaps more arcane reason, is that the period from 1974 to 2000 was a period of disinflation, where the inflation rate came down from 11.03% in 1974 to 3.38% in 2000. These rates are averages for the year, and come from www.inflationdata.com, a very useful source for this kind of data.
We note, for completeness, that the highest rate of inflation in that time period was the 13.58% average inflation rate for 1980. Generally, inflation is considered to be bad for financial assets, and disinflation good. Indeed, the reason for the Bull Market of the 1980’s and 1990’s may be that the Federal Reserve brought inflationary expectations back down to their historic norm of from 1 – 3% from the excessively high levels of the 1970’s. It is interesting that the highest inflation in the United States is in the 1913 to 1919 period at around 8.7% and the 1970’s were next with an average rate for the decade at 7.09%.
One of the best hedges against inflation is gold, and gold peaked in 1980, along with inflation, and declined into an ultimate bottom in the 2001 time period. For the record – Gold peaked (and again these are average prices for the year) at $615/oz in 1980 and the low year was 2001 at a price of 271.04/oz. These prices are from the London PM Fix, converted to dollars. The Secular Bear view is supported by the double top on the SPX that occurred in October of 2007. This is shown in the monthly chart of the SPX below. However, from a technical perspective there are several problems with the secular bear view and we will discuss these below.
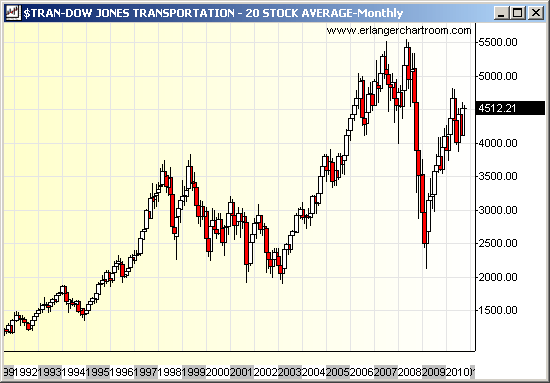
First, look at the chart of the Dow Transportations over the same time period as the SPX chart. Here at the FRED Report we believe the Transports are the most economically sensitive index. Note how the Transports declined from 1998 to 2003 forecasting a slower economy and then made substantial new all time highs into 2007. They then declined and made higher lows (vs. 2000) in 2009. For the record, the high in 2008 was 5536.57, around 46% higher than the 1998 high of 3797.05.
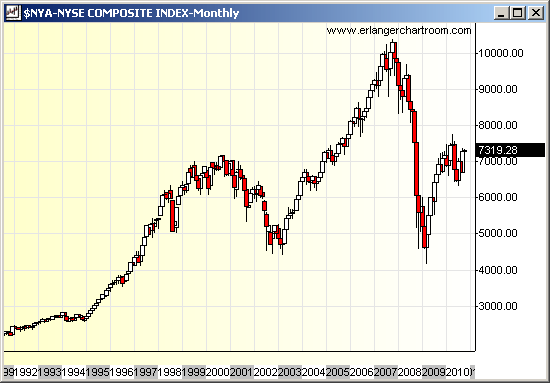
One argument against the significance of this is that the Dow Transportation Index contains just 20 stocks as opposed to 500. Therefore, we turn our attention to the New York Composite Index (NYA). The NYA is composed of approximately 2300 common stocks, all of the common stocks traded on the New York Stock Exchange. We note that this index peaked in October of 2007 at 10387.17, which was around 44% from the high set in September of 2000 at 7194.18. We note that the NYA has a bit over 4X the number of issues contained in the SPX, and 115X the number of stocks in the Dow Transportations. Yet, the percent move above the 2000 highs was almost the same as the Transportations.
Stock markets reflect strength in the underlying economy, and have their worst declines as the economy goes into recession. The periods 2000 to 2003, and 2008 – 2009 were not exceptions to this. Historically, small cap stocks have outperformed as the economy emerges from recession - For full discussion of this see our research piece “January effect and small cap stocks”, from the January 2009 FRED Report Monthly Review. How did smaller cap stocks fare from 2000 to 2007? We show two indexes: the S&P Mid Cap index (MID) and the S&P Small Cap index (SML). The MID peaked in July of 2007 at 926.67, approximately 69% above the high of September 2000 at 549.63. The SML behaved similarly, peaking at 445.82 in July of 2007, approximately 87% above the high of 238 set in July of 2001. It is worth noting that a significant peak occurred in April 2003 at 258.23. This was an all – time high in the SML, and likely reflected that the recession of 2000 to 2002 had ended. Using that as the early 2000 peak yields an up move of “only” 73%.
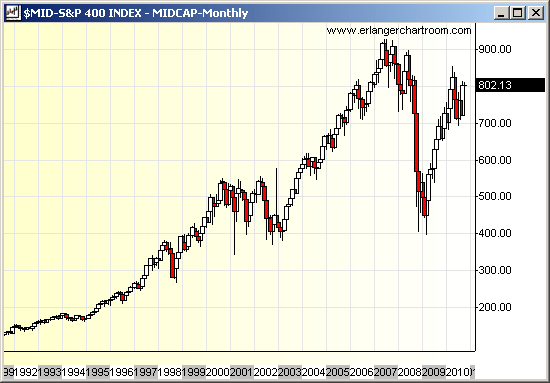
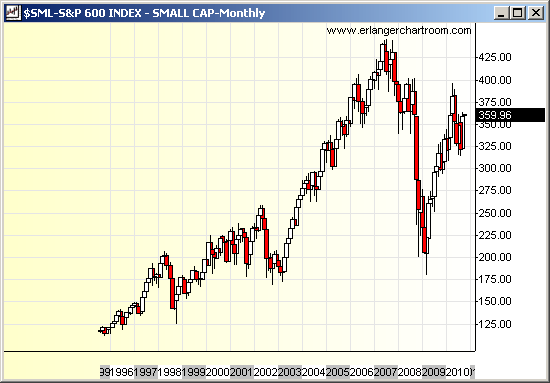
The question we respectfully ask is this: do rallies of 44% to 73% above the highs of the year bear markets commence suggest an ongoing, multiyear bear market? Certainly, most indexes did NOT make lower highs in this period. On a price basis, bull markets occurred across the board. We admit this argument does not take valuations into account, nor do we attempt to answer the question of whether we started a secular bear in 2007. We will deal with these issues in a future research piece, but we would like to point out a couple of things many analysts may be overlooking. First and most important, the MID led the way in 2009, just as this index had led after other recessions, and was around 8% from the all time highs set in July of 2007, at the April 2010 peak. Second, we note that the September 20, 2010 close of 802.10 is above the 2000-2002 high of 554.01 on the MID. On the NYA it is less dramatic – the September 2010 close of 7281.07 is slightly above the September 2000 high of 7194.18, but it is still above the 2000 highs. We define a BULL market as a market making higher highs in price, and we have certainly done so from 2000 to the present.
Member Log In

Who is Fred Meissner, CMT?
Listen here:
The FRED Report is not authorized, endorsed, or affiliated with the Federal Reserve of St Louis and its FRED Economic Data.


