The Fred Report - Mid Week Update June 14, 2017
The FRED Report – Financial Research, Education & Data
Mid Week Update
Volume 9, Issue 44
June 14, 2017
Download PDF Version here
Update of Market View
We have been asked more about the risk on Apple (AAPL) and some of the other strong stocks in 2017. We want to amplify on our commentary the action over the last few days if they have a severe correction.
One of “Fred’s Rules” is that any stock that doubles the performance of the S&P 500 is vulnerable to a 50% retracement of that advance even if it is ultimately going to make higher highs. In order to discuss this fully, we will use AAPL as an example. It exhibits this behavior on most of the stock’s large corrections. We give examples, below.
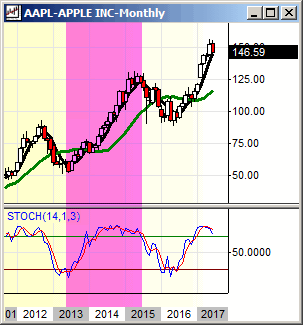
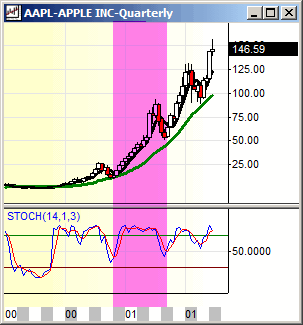
The first correction we will look at is the move from 1/09 to 9/12. That move went from 11.13 to 100.75, a gain of 89.62 points. Multiply that by 50% and you get 44.81. Subtract that from 100.75 and you get 55.94. The correction low for AAPL April 2013 was 55.03. You were off by a small amount. The second correction we look at is the move from 4/13 to 4/15. That move went from 55.03 to 134.54, a gain of 79.51. Multiply that by 50% and you get 39.75. Subtract from 134.54 and you get 94.78. The low in May 2016 was 89.47. This was off by more, but is still pretty close. Since AAPL has split several times and the prices from the earliest correction never really traded that is about as far back as we should go but you can play with this if you want. Here are quick numbers: 29 - .91= 28.09/2=14.04. The low of the correction was 11.17, again fairly close. If this was a major peak in AAPL the numbers are as follows: 156.65-89.47=67.18/2=33.59. 156.65-33.59=123.06. If AAPL hits that price over the next 6 months, then we would buy the stock!
Obviously there are some rules for this, the biggest one being that one has to have a buy signal around that 50% level. The other is not to be too precise (i.e. drop the decimals!). And, realize these stocks do not have to make a 50% retracement but rather use this as a guide to the maximum risk we would expect in an uptrend. We show monthly and quarterly charts of AAPL, below. Geoff Garbacz has another interesting take on Friday’s trading action and we publish that in the Chart of Interest section.
Other Points of Interest
The Powershares QQQ Trust (QQQ) crashed on Friday, June 9th. The $64,000 question is why haven't more people pointed out what clearly happened?
On Friday QQQ was trading fine until about 10:15 a.m. EDT when all of a sudden it began to drop. The price at that time was $143.84. It fell to a low on Friday of $138.11. So from the peak at 10:15 a.m. it fell 3.98%. From the low at 2:45 p.m. EDT, QQQ rebounded to close down by -2.44%.
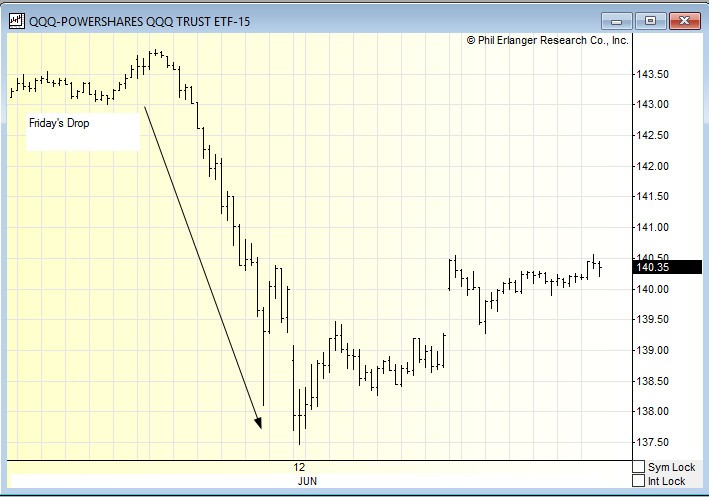
Typically, a couple times a year the QQQ will drop more than -2% in a single session. However, what made this so unusual was the volume associated with the drop.
Volume for last Friday on QQQ was 104,765,166 shares. Thursday's volume was 23,137,362 shares. So the volume on Friday was 4.5X Thursday's action.
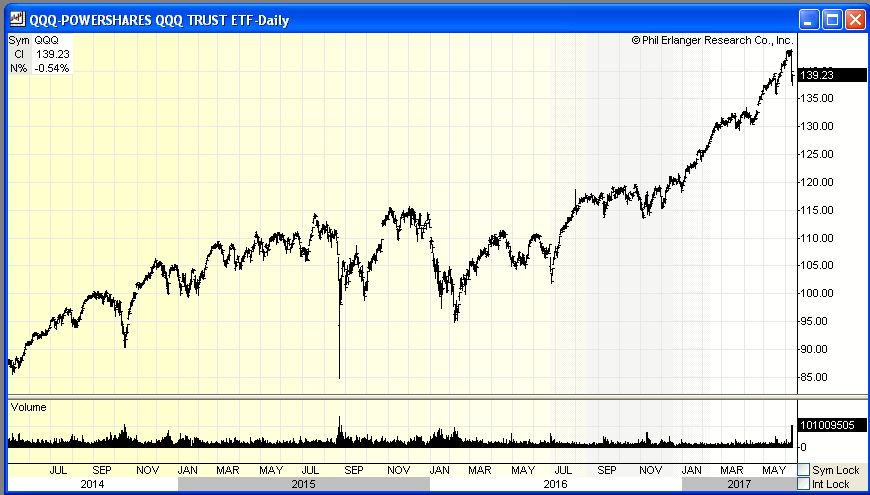
In 2017, there has been only one day above 50 million shares on the QQQ and that was on May 17th when the QQQ fell -2.54%. The last time volume was this high was August 24,2015 when QQQ traded 145,475,800 shares.
That date was the worst drop since October of 2008. The Dow Jones Industrial Average lost 1,000 points in early trading. For the day, the Dow lost 588 points while the QQQ lost -3.85% or $3.94.
A catalyst that day was Oil dropping under $40 a share for the first time since 2009. Also, the Chinese market was in trouble as well. The Chinese economy had fallen below a 7% growth rate. So that puts Friday's drop in context on how big volume was Friday.
What was more interesting to us was that when you looked at the underlying names in the NASDAQ 100 Index many stocks fell much more percentage wise than the QQQ BUT volume on these stocks was not nearly as high. How could that be?
The NASDAQ 100 Index is a modified market cap weighted index. Here are the weightings of the Top 5 % of QQQ that make up 37% of the Trust.
Apple (AAPL) is 11.60% of the weighting. Microsoft (MSFT) is 8.20%. Amazon (AMZN) is 7.00%. Facebook (FB) is 5.31% and Google (GOOG) is 4.97%.
Upon review the above volume charts, none of these names had unusual volume that was 2X the highest amount seen for the year or 4.5X Thursday's volume. So how could QQQ have such crazy volume yet the top names did not have the same volume but they had even bigger intraday price drops?
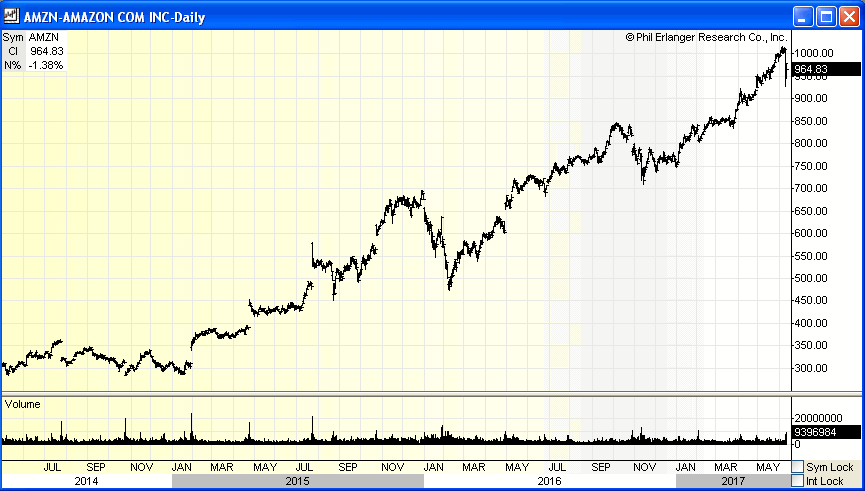
Amazon intraday traded from a peak of $1012 to a low of $927 before closing at $978.31. The range was a drop of -8.4% before closing down -3.13%.
Facebook (FB) intraday traded from a peak of $155.59 to a low of $146.61 before closing at $149.63. The range was a drop of -5.77% before closing down -3.28%.
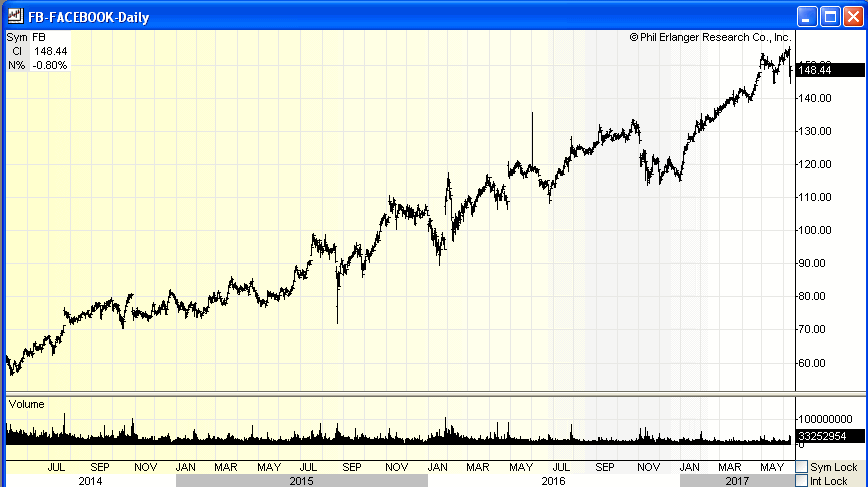
The other stocks mentioned above in the QQQ had similar stats for Friday. So why did the top stocks in the QQQ drop much greater than the QQQ?
The answer is pretty simple. Passive investing has decreased liquidity which will create more volatile days on the underlying names in an ETF when a monster fund, group of funds or someone that influences many decides to hit the exit button causing volume to surge and impacting the top underlying names even more than the ETF.
So it becomes incumbent on investors to understand how their positions could be impacted as "passive investors" who are really active investors close out their "passive" security at the same time creating potential intraday or several days of chaotic trading.