The Fred Report - Weekly November 8, 2010
The FRED Report - Financial Research, Education & Data
Volume 2, Issue 89
Trading Week Starting November 8, 2010
Download PDF Version here
Summary of Market View
The stock market has made new highs for 2010. While we would have preferred to see a pullback after the election, we have been, and remain intermediate-term bullish.
Treasuries continue to fall, and rates rise but we are close to price targets and this move may be about over – stay tuned.
The commodity markets seemed poised for a year-end up move. The only bugaboo here may be the dollar, which still looks positioned to rally. If the dollar is going to advance it should do so right away.
Stock Review
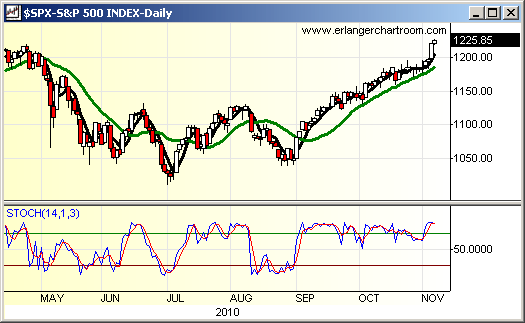
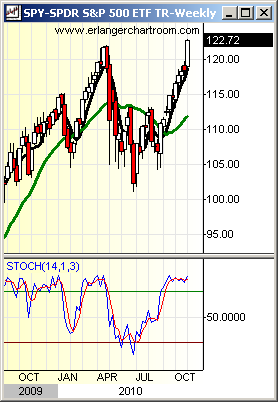
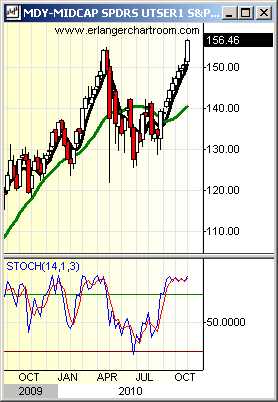
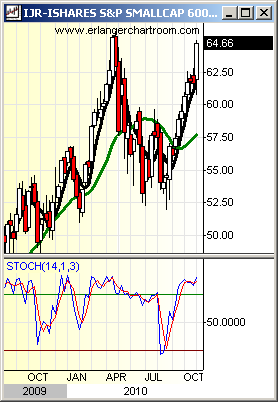
The stock market did not pull back after the election, as we thought it might. Rather, the SPY (SPDR S&P 500 Trust) has made new rally highs for 2010. We have been asked what this means and whether this is a false breakout. We believe this is a real up move and the yearend rally we have alluded to since October has started. In terms of positioning, we note that the IJR (iShares Small Cap 600) is now lagging mid and large cap names. We think it is time to move up the capitalization ranks, and would emphasize mid and large cap names for now through the end of the year, with new money.
We have often mentioned that the hardest market for a technician is a strong uptrend with overbought indicators, and that would seem to be to be what we are seeing (and could continue to see into the end of the year) right now. With regard to a false breakout: (a) the chances are roughly 40% that this is a false breakout; with a pullback that would have been much less, and (b) if this is a false breakout this coming week should be down – in other words it should be obvious by the end of the week. That said, we remain intermediate-term bullish and think the market will be higher on December 31st than it is today.
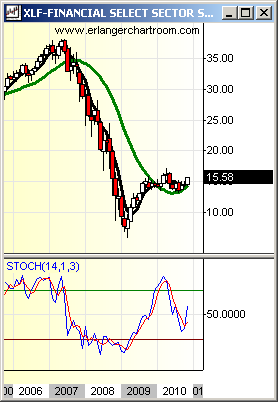
The solution should be, for those advisors who raised some cash, to start putting that money back to work slowly in attractive sectors. Speaking of sectors, we observe the rally in the XLF (SPDR Select Sector Financial ETF), but note that it remains the weakest sector. While a yearend rally should lift all boats, we would tend to emphasize more attractive sectors (Materials, for example), rather than financials. We show the XLF chart in the Other Charts of Interest section at the end of this report. See charts in November’s Monthly review as well.
Fixed Income Review
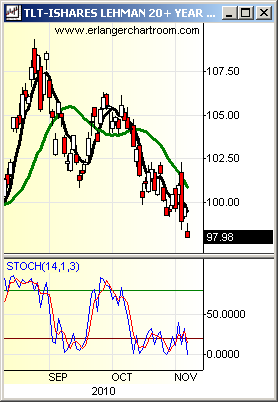
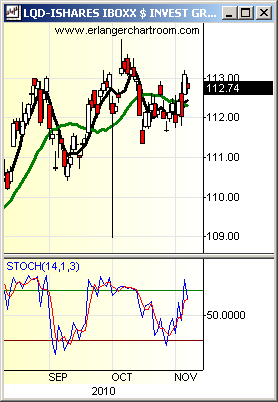
The TLT (Barclays 20 Year Treasury Bond iShare) has continued to fall, moving down to 97.98, which is close enough to 96 that the majority of the forecast down move may be over. The LQD (Investment Grade Corporate Bond iShare) has held up better, as anticipated. We will monitor these two instruments over the next few weeks, but we are in a price area where this could possibly change, and it could be to our advantage to, once again, buy treasuries.
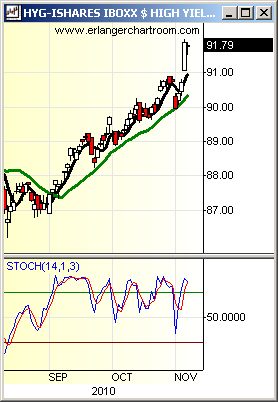
In addition, the HYG (High Yield Corporate Bond iShare) has broken out above the 90-area resistance. For some time, we have been writing that high yield bonds have been more of a proxy for risk than a direct interest rate play. The next strong resistance on the HYG comes in around 96, and less risk adverse advisors could start to add positions in the HYG with this target area in mind.
We have mentioned throughout the year that we are long-term bond bears, and this has not changed. However, we realize that some advisors MUST buy bonds for clients. Right now, we still believe that mid duration bonds offer the best risk reward.
Commodity Review
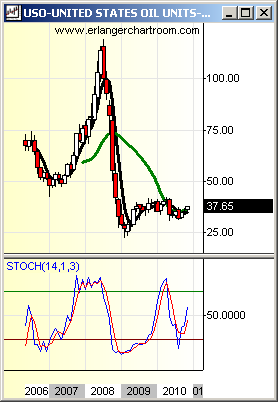
Gold moved to new highs last week and it now appears that the pullback to the 128 area on the GLD (SPDR Gold Trust) was the correction we had been looking for. We continue to like commodities, including gold, into the winter, and note that USO (United States Oil Fund) has also moved above the 37 area resistance.
We note that there is a gap on the GLD, but this seems to be a continuation gap and as such does not have to fill (see our Special Research Articles under the Reports menu for more on this). For those who want to overweight gold, I could start to add positions in here, realizing that if the gap is going to fill it will likely be sooner (i.e. this week) rather than later.
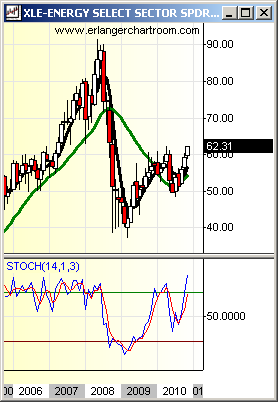
While oil seasonality has been screwy this year, it normally rallies in the winter and looks set up to do so this winter as well. Oil stocks have also been a good play at this time of year and they look to be now. The XLE (Energy Select Sector SPDR) has a favorable chart pattern short-term and the stocks have decent yields. On the monthly chart, the XLE has lagged the market and we do not normally recommend lagging sectors. In this case, because of seasonality and yield, we will make an exception.
We continue to be long-term commodity bulls.
International Review
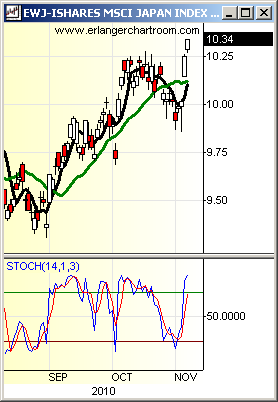
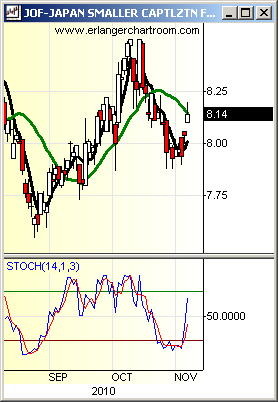
We will focus our attention on Japan as this country has lagged the other Asian countries but has seen some pick-up in the last few sessions. Unlike China and the US, the big cap Japanese indexes are performing better. This suggests that the domestic economy is less robust than the export oriented sectors.
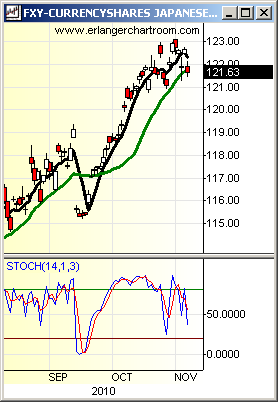
One of the key components here is the Yen, and the chart of the FXY (CurrencyShares Japanese Yen Trust) looks a bit toppy to us. We have mentioned the chance of a tradable move up in the dollar in other reports, and it looks like either I am wrong about this, or the dollar made a cutout low last week and should rally immediately. While we have to see which it will be, it looks to us as if the dollar should rally when looking at the indicators. This should benefit the EWJ (iShares MSCI Japanese Index Fund) more than the JOF (Japanese smaller capitalization) at least at this time.
We mention that we continue to prefer Singapore overall, as this is a growth oriented economy that also sells to China. If you are in Japanese ETFs it looks like the FXE (Rydex Currency Shares Japanese Yen Trust) should fall off, and the EWJ (and to a lesser extent the JOF) rally.
Weekly Chart of Interest
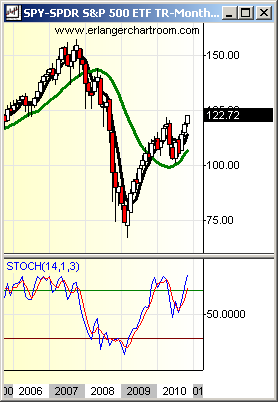
We show monthly charts of the XLF (SPDR Select Sector Financial ETF) and SPY (SPDR S&P 500 Trust). We notice that, in spite of last week’s strength, the XLF is lagging the broad market substantially. Also, note that unless the XLF can move above 18 it is still below resistance.
