The Fred Report - Weekly February 21, 2012
The FRED Report - Financial Research, Education & Data
Volume 4, Issue 15
Trading Week Starting February 21, 2012
Download PDF Version here
Summary of Market View
Last week, stocks had a choppy week that is typical of options expiration. This week should be positive, although we are starting to see some signs the rally has gotten long in the tooth.
International bonds are recovering a bit, and look more attractive than US treasuries at this time.
Oil looks like it is ready to start an advance, and the big oil stocks still look better than the service names. This has been the case since 2011. This might be because the European/international situation looks to resolve itself favorably. European currencies also look to rally at the expense of the Japanese Yen.
Stock Review
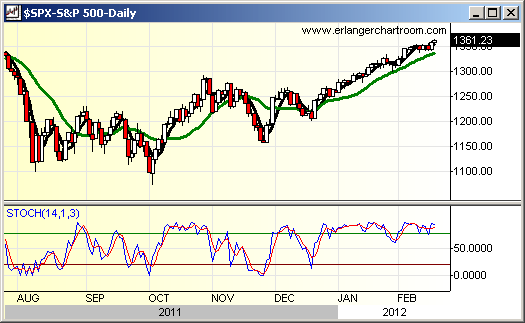
The stock market continues to look positive and could trade up through the 137 area on SPY (SPDR S&P 500 Trust) this week. At the same time, we have become a little more cautious – we are finally seeing signs that other market pundits and some institutions are finally embracing this rally. One of the concerns we discussed in last week’s Weekly Report is that sentiment may fall off, and this has started to occur, as Investors Intelligence %Bears fell to around 25% from around 28%. This is in line with our thinking – the market can continue up – but we are beginning to see some signs that a correction could occur for the first time since last November. We remain with a target of 140 to 143, but that is now a short distance away. We think an immediate decline is unlikely – but a move below 130 would concern us.
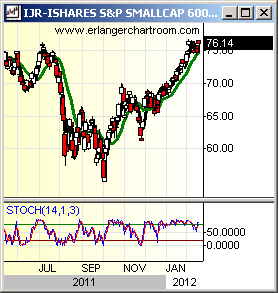
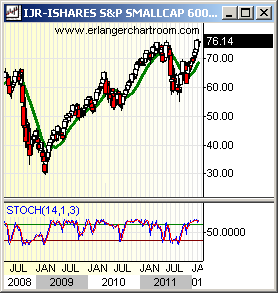
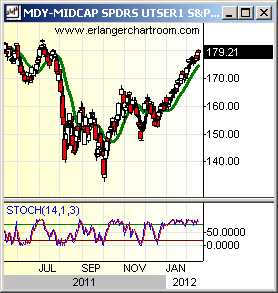
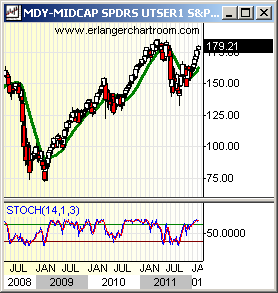
Whether or not there is a correction the market still looks intermediate-term positive and economic numbers continue to improve. This means that advisors should be adding small cap allocations and some small cap sectors to portfolios. These should create some alpha in portfolios over the next year. Our preferred scenario, however, is good news out of Europe and a rally in those indexes, along with ours. We show small and mid-cap indexes, below.
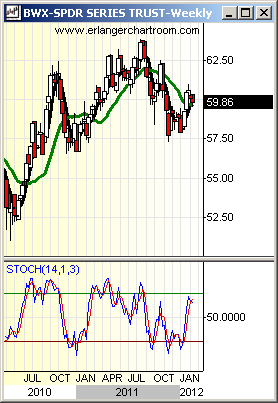
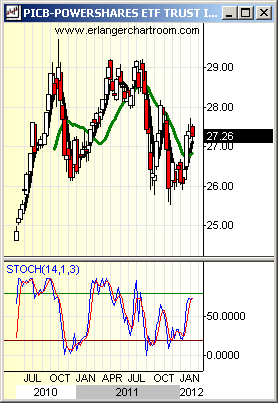
There have been some interesting developments in the currency markets (see the”International” section), so we take a look at some of the international bond ETFs we follow. PICB (Powershares® International Bond Portfolio) and BWX (SPDR Lehman International Bond Index ETF) both look strong, but PICB looks to be a better bet because it has less Japanese exposure – and the Yen looks weak now, and could weaken further as the Euro stabilizes. Both of these look better than two other funds we follow – BWZ (SPDR Barclay’s Capital Short-Term International Bond ETF) and ISHG (iShares® S&P/Citigroup 1 -3 year bond ETF), which are both shorter-term in duration. The above, in turn, suggests that some of the fear is coming out of international bond markets as longer-term bonds appear to be able to rally more, and rates fall.
We have had, and still have, concerns that US treasury rates could rise as international rates fall – so they would meet somewhere in the middle. As such we recommend moving some bond money out of TLT and into PICB or BWX. So far, TLT has held the 116-area support, but should that break for two successive days a move to 110 or even 102 could result.
Commodity Review
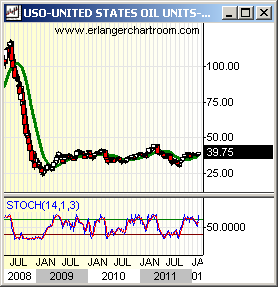
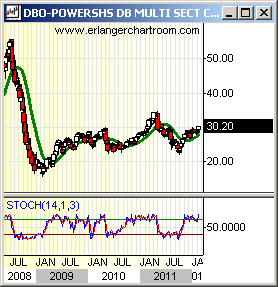
We will use this space to look at energy stocks this week. First, we look at some underlying oil ETFs: DBO (Powershares DB Oil Fund) and USO (United States 12 Month Oil Fund) and note that DBO is stronger, which suggests demand is becoming embedded in the oil market (DBO is not front month loaded like USO). But, both of these look like head and shoulders bottoms, with more upside over the next few months. If a rally in oil occurs, the stocks in these ETFS should move up as well.
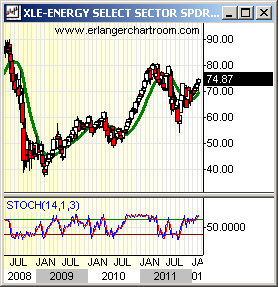
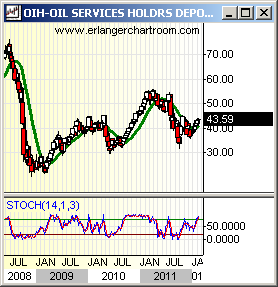
The big oils in the XLE (SPDR Select Sector Energy ETF) continue to look more positive than oil service stocks at this time. XLE has started to break out of the recent consolidation and looks to advance towards the recent highs of 80. To put OIH (HOLDERS Oil Service ETF) into perspective, it would be trading around 50 and would be heading for the 55 area. There are legislative issues around the services and drillers that could cause OIH to continue lagging into summer.
We have mentioned concerns about the Middle East, and these could be part of the reason for positive oil prices and advances in the big oil stocks as they are mostly suppliers. We will have to see how this plays out, but for now we expect oil and the oil stocks to rally over the next few weeks.
International Review
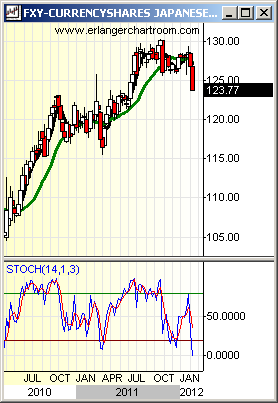
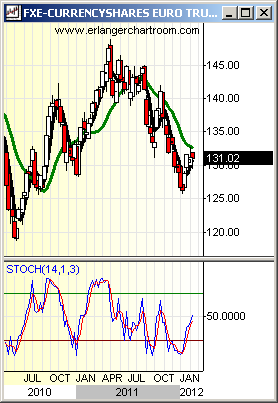
We take a look at some of the currencies this week, as the FXY (Rydex Currency Shares Japanese Yen Trust) has finally started to weaken. FXE (Rydex Currency Shares Euro Trust) has been relatively stable, as this has occurred. We have alluded to this possibility in the January Monthly Review, and it makes sense from a macro perspective; Japan has signaled a desire to intervene and bring down the value of the Yen, but is unlikely to do so as long as the Eurozone is unstable. So, the recent move down is likely another indication that Europe will stabilize.
In our “Year Ahead” research piece in the January Monthly Review, we discussed some possibilities for changes in the intermarket relationships that have prevailed over the last few years. One area of concern and interest is the intermarket relationships surrounding the US dollar Index. It is possible that we see a move down to the 115 area on the FXY and a small advance in the FXE. If this occurs, the dollar may actually advance or at least remain stable.
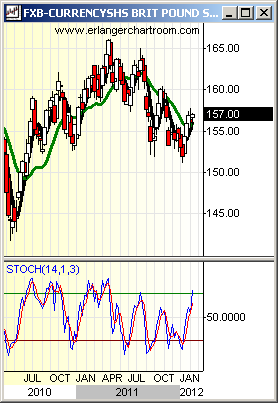
We show several charts here, and in addition refer readers to our currency report (Under “Special Research Articles” on the website). The most improved chart for a quick trade to the upside is FXB (Rydex Currency Shares Pound Sterling Trust) – not surprising given that this is a European alternative to the Euro. In addition we continue to believe that FXF is a strong alternative – but this is a “thinner” ETF and may not trade as well for those taking big positions. Either way, it looks as if Europe is improving and this should be good for the currencies and equity markets.
Weekly Chart of Interest
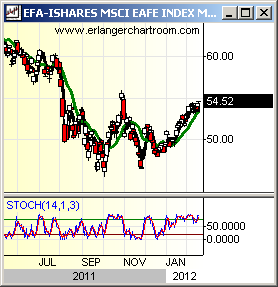
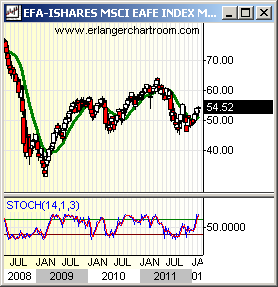
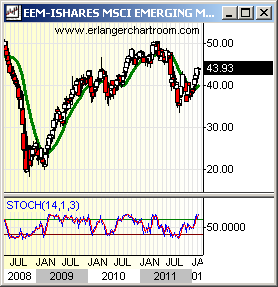
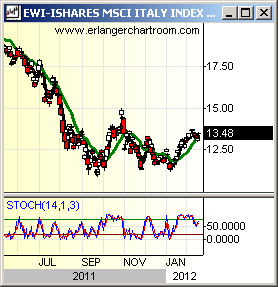
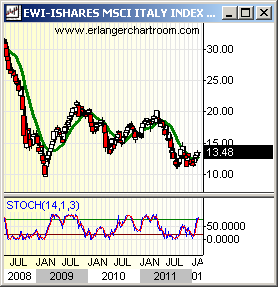
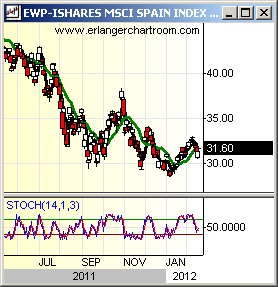
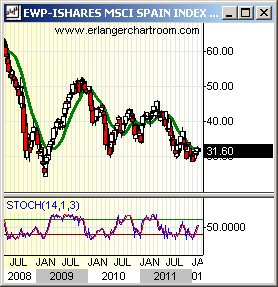
We look at the chart of EFA (iShares MSCI EAFE Index Fund) and EEM (iShares MSCI Emerging Markets Index Fund). The reason is that the accumulation model on EFA has moved above that of the EEM significantly for the first time in two years. This suggests two things. First, this is forecasting a successful end to the European imbroglio, and second, it is suggesting a strong rally in European developed markets. In last week’s Weekly review we mentioned that a quick trade could be setting up in Emerging Markets over the next month, and this is still the case. In other, recent, reports we have mentioned that EWL (iShares® MSCI Switzerland Index Fund) and EWD (iShares® MSCI Sweden Index Fund) are, from a technical perspective, the best way to invest in a European market rebound. However, for those who wish to SPECULATE – it might be worth adding some EWI (iShares® MSCI Italy Index Fund) and EWP (iShares® MSCI Spain Index Fund). Both of these have been lagging strong country ETFs – and may be prepared to rebound.
