Research Piece: Investor's Intelligence Bears
Research Piece: December 2009 - by Fred Meissner, CMT
This month’s research piece is on sentiment in general, and the Investor’s Intelligence numbers in particular. Sentiment numbers are derived from two types of sources. One is empirical market activity, such as options activity or mutual fund cash levels analysis. The other source is various sentiment polls conducted by organizations. Sentiment indicators rely on the philosophy of contrary opinion, which suggests that markets will move against the majority position much of the time.
At The FRED Report, we tend to look more closely at measures of BEARISH opinion. We feel that while there can be complacent (and therefore inactive) Bulls, and investors expecting a correction, it is unusual for Bears to remain inactive. They usually sell, and sell quickly. In addition, they are not quick to buy. This is why high bearish sentiment numbers in a rising market are so positive – they are a measure of fuel for a bull move as they are forced to deploy cash. Readers can see our sentiment index in this publication which tracks bearish opinion only. We have followed this index for some time.
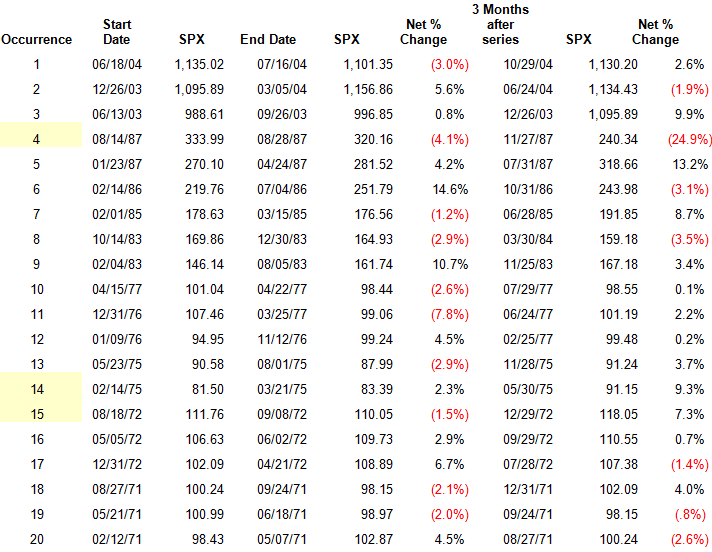
In the last two weeks we have seen two readings of Investor’s Intelligence Bears numbers in the high teens (17.6% and 16.7% bears respectively). Two low numbers in the teens are rare, in my experience, and we did some analysis (with surprising results!) that we show below. In the table is all occurrences of numbers below 20 for two weeks or more in a row. We have taken one small liberty with the numbers. In three instances we had long strings of below 20’s that were broken up by just one number above 20. We combined these, as it does not impact the data. So you have them, these were #4, #14 and #15. Otherwise, we take the weekly S&P 500 (SPX) closing number at the start of the series, then at the end of the series, and compare it to the closing week of the third month after the series.
Readers can judge the results for themselves, and also look at intervening weeks if they so choose. Several things stand out for us, however. The first is that there were only 21 occurrences of this type of sentiment number since 1971 (38 Years) so this is rather rare. Second, of the 21 occurrences, in only 8 was the SPX lower at the end of the series of low numbers. Last, and perhaps most interesting, in only 7 of the 21 occurrences the SPX was lower three months later. Readers should check for themselves the variance between the end of the series and three months out – it is not consistent to me, nor significant. The biggest positive three month change was in 2003 at 99.04 which was around a 10% up-move from the end of the series. The worst was the crash of 1987 at 79.82, which at the time was around a 25% down-move from the end of the series. As you can see from the table, the 1987 series had relatively few occurrences.
Throughout my career, I have always used sentiment indicators as CONDITION indicators and not timing tools. By this I mean that they can suggest trading conditions have worsened, or improved, but without confirmation from the indicators and trading set-ups on the charts, they should not be acted upon independently. This seems to be the case now. Certainly, the caution flags are out – but until other indicators confirm, we have to give the uptrend the nod. Please see the table below – the results are surprising!

Disclaimer: