Research Piece: Moving Averages
Research Piece: March 2010 - by Fred Meissner, CMT
Moving averages are one of the building blocks of Technical Analysis, and we use them at The FRED Report. We are often asked questions about them, why we use the averages we use, and the advantages and drawback of this approach. In this article we will answer some of these questions, shed some light on trend analysis, and give some references for interested readers. Of course, interested readers can also contact me directly with questions.
Moving averages are used to smooth stock market data to assist in forecasting market trends. Notice we say “trends” – by their nature, moving averages are less useful in trading ranges. Because a moving average deals with past data, it will lag the price action, which is not necessarily a bad thing, as trends tend to fluctuate and not simply move in a straight line. One facet of moving average analysis I do like is that moving average signals generally are precise and not open to interpretation, as basic chart analysis can be. By this I mean that one analyst’s “High Level Consolidation” can be another’s “Double Top”, but when a moving average crosses another, or price moves through a moving average, this is not open to interpretation. It has either happened, or not, for all to see.
One question about moving averages regards their periodicity. Why, for instance, did the 200 day, 50 day, and 10 day moving averages become so popular? One simple reason is that they are easier to calculate – don’t forget that moving averages were being used before the advent of personal computers (and, for that matter, hand calculators!) so people chose easy numbers to calculate. Another method is to use what some technicians call “half span differentiation”, which is a fancy way of saying, “measure the cycle and take ½ of it as your period”. This method is what has given us such indicator parameters as the 14-day Stochastic, which I also use – which is ½ of the monthly (or 28 day) cycle. In fact, some say the absolutely correct way to formulate moving averages is to take the distance between several sets of lows on a market or stock, average them, and then take ½ of that number for your moving average. There are also simple, weighted, and exponential methods of calculation. All of these have their proponents.
With moving average analysis, we have chosen to use 5 and 20 period simple moving averages. We have several reasons for this, but before we get to them we should mention that, in our opinion, the exact periodicity of the averages is not as vital as understanding WHAT we are trying to measure, and WHY we are measuring it. WHAT we are trying to measure is trend intensity, and WHY we are measuring it is to make money for our clients. We do not believe in optimization, rather we believe that markets can change, but principals remain constant. The answers to the above questions are that Technical Analysts believe prices are NOT random, can and do trend, and this trending can be measured to good effect. At the same time, we believe a simple approach – a short-term average crossing a long-term average, is effective for measuring trend. We understand that there are other ways to measure trend, and we use them as well. However, for the charts we publish, and the methods we teach in seminars, we believe a simple, easily understood and applied method that captures large parts of a trend, is more important than trying to fine tune a complex method which cannot be easily duplicated by our clients. For those of you who wish to delve into this topic we are certainly available to help.
We have picked the 5 and 20 period simple moving averages for two basic reasons. The first is rather funny. Most of the advisors who are our clients use software from Thomson Reuters, and the default on their dual moving average system is the 50 and 200 day averages. We believe these to be too long, and our clients can easily remember simply lopping off a zero – which gets us to the 5 and 20. The other, more important reason is that 5 days is one trading week, and 20 days is around one trading month. For those who wish a longer time period, we advocate using weekly charts, and we use the two time frames in conjunction.
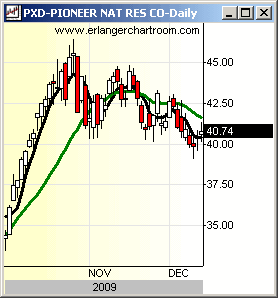
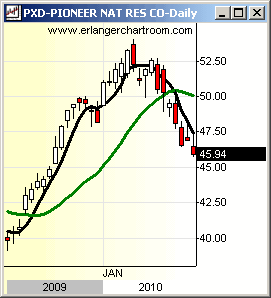
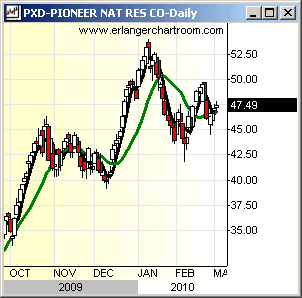
We mentioned above that moving averages work well in strong trends, but not so well in ranges. We show close-up charts of both, plus a chart of the stock for several months that encompasses both phases. Notice how, on PXD the stock goes through 2 basic phases. The first phase is the trading range, or consolidation phase, where the moving average crossover signals (5 crossing the 20) produce no gain. This is often called a whipsaw. After the trading range phase comes the trending phase, where the moving average crossover (the 5 crossing the 20 once again) produces a solid gain in the stock.


While an analysis of trend following methods is outside the scope of this piece, this leads to one of the key tenets of trend trading – which is to take all of the signals given by the moving averages. The idea is that trading ranges beget trend, which beget trading ranges once again. The hope is that the gains in a trend will offset the losses one sees in a range. Since the trader can never be sure when the stock is going to switch phases, one must take ALL the signals. By the way – we picked PXD for illustrative purposes but this method works on ETF’s, and even mutual funds, so our clients who use funds exclusively can benefit from this methodology.
The reader can see the potential for (a) gain, and (b) risk management in the use of moving averages. We realize this subject may be new to some, and will happily answer reader’s questions via email, or telephone.
Disclaimer: