Research Piece: January Effect and Small Cap Stocks
Research Piece: January 2010 - by Fred Meissner, CMT
One common question this time of year is regarding the January Effect. The January Effect was first noted by Arthur Merrill in his publications, and suggests that small cap stocks that experience heavy tax loss selling in December often rebound in January, creating the opportunity for larger than average gains in a short amount of time. This year, tax selling is less likely to be a factor as the market has experienced a strong year to the upside. Traditional Tax Loss Bounce candidates occur in negative years. In addition, often mutual fund selling occurs in October. Thus, we read articles in various years suggesting that the January Effect has come early as those stocks often rebound in November/December.
In researching the January Effect I did come across something of more than passing interest, however. To place this into context a little history is in order. Over the very long-term history of the stock market, small cap stocks have outperformed large cap issues. Depending on the index one uses to measure the respective weightings, the bias in favor of small caps is 1% to 5%. This is small, but significant. Small cap stocks are considered by some to be more risky, and the outperformance is considered to be payment for assuming that risk. There are problems acquiring data and deciding what indexes to use. For example, in the 1960’s many compared the Dow Industrial Average to the Value Line composite, which has various problems including weightings of the respective indexes and the fact that the Value Line contains big caps as well as small caps. What analysts were looking for in those older articles was a measure of speculation and not of strict capitalization. Sometimes the American Stock Exchange Composite was used and there are problems there too. The biggest problem is a preponderance of stocks in the most popular sectors. It was easier to go public on the AMEX, so many speculative “Fad Type” stocks showed up there. This was not unlike the NASDAQ technology boom in the 1990’s, where small tech stocks showed up on the NASDAQ rather than the NYSE, because of listing requirements. The other problem, of course, was picking just which year’s small caps outperformed – as they do not outperform every year. The following data will shed some light on this question.
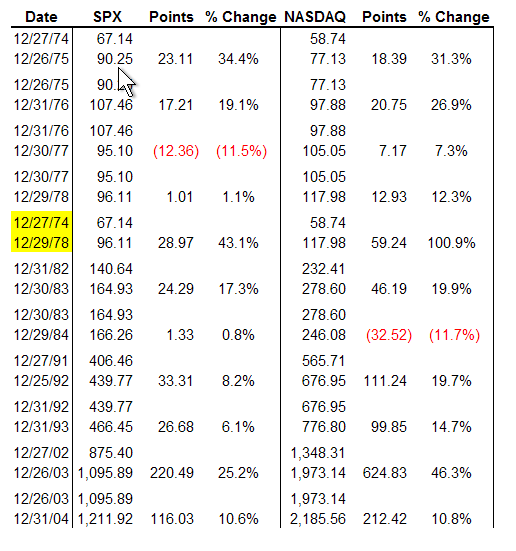
What we found, looking at several different data series, is that small cap stocks generally outperform in the 2 years following a recession. After the 1973- 1974 recession (possibly the worst on record, except for the1929 to 1932 experience), small cap outperformed until 1978, and it was significant. The table below shows how the SPX and the NASDAQ performed after various recessions since the NASDAQ Index was created in 1970. We show two years in each case, except for the 1974 – 1978 period of stagflation where we show all four years, but the data is broken down by year so you can examine each year. We define a year as the last weekly close in December (we maintain weekly data, and we do not believe that going to daily data would change the conclusion all that much) for each time frame.
Readers can see that with the exception of the 1983 -1984 period, the NASDAQ did significantly better in virtually all cases. One could argue that the 2002 – 2003 period favored the NASDAQ because tech had been beaten down – but the NASDAQ premium was not appreciably larger than in 1991 – 1992 when this problem did not exist.
In the last few weeks of 2009, we noted that small and mid cap stocks looked to outperform their large cap brethren. This data suggests that those technical signs have precedent and advisors should be looking hard at smaller cap names to augment performance for at least this year, and possibly next as well.

Disclaimer: